On the pod last week, Cam Abadi and I got into the wild gyrations in stock markets over the last ten days. It was a really interesting conversation about the role of narrative in shaping markets and the mediated relationship of those markets, in turn, to the broader economy. You can check out the pod here.
As a summary of the action of the last few weeks and what it portends, I really appreciated John Plender’s latest column for the FT which posed the question: as the macroeconomic balance shifts and monetary policy responds, how much fragility will be exposed, how many trades will unwind?
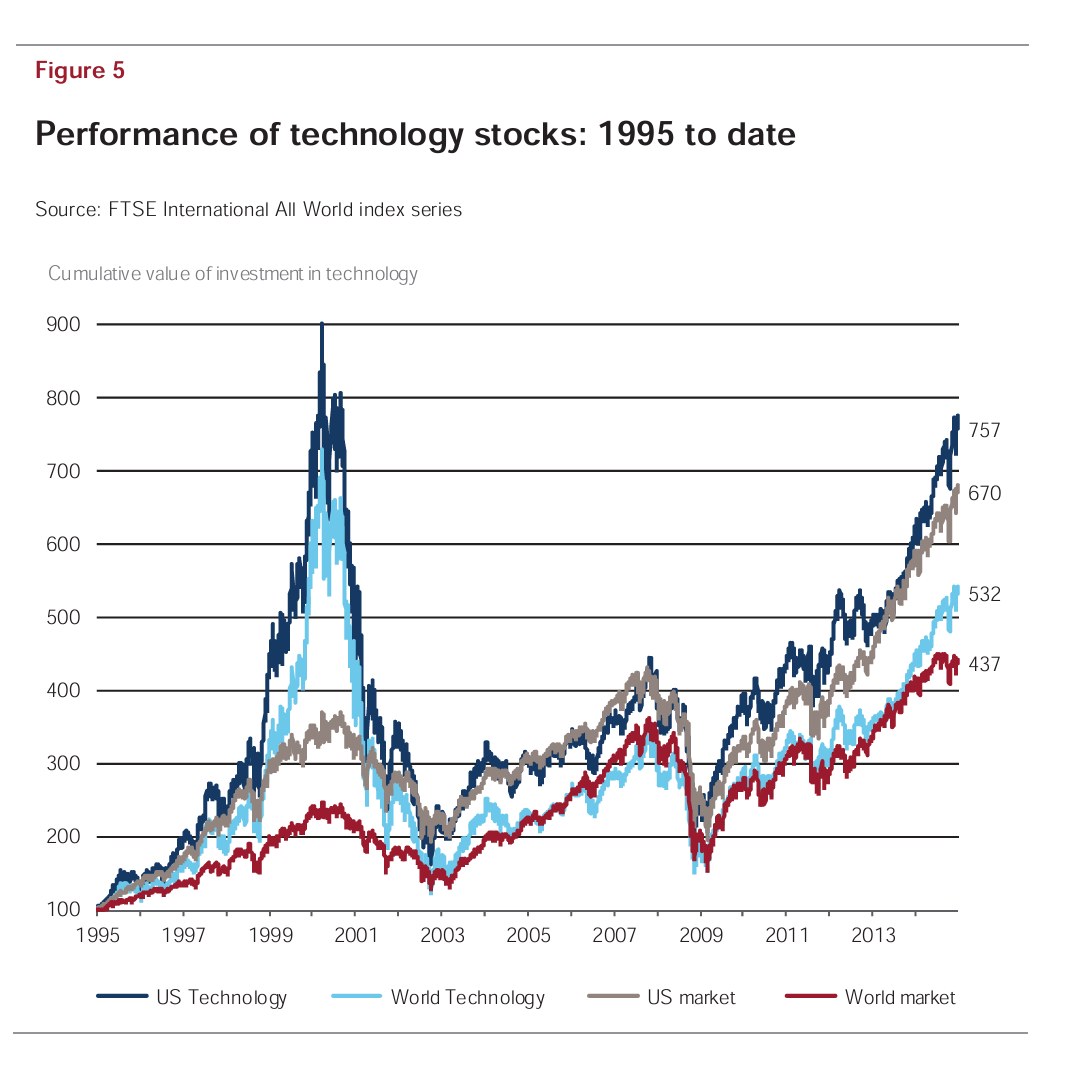
This all marks a step change in the evolution of the business cycle. During this century and within the memory of most people on today’s trading floors, recessions have been precipitated by financial booms turning to busts. Central banks have then acted as lenders and market makers of last resort to address the resulting financial instability. Such action has taken place against the background of quiescent inflation courtesy of globalisation and the erosion of the pricing power of labour and companies. In the 1980s and 1990s, by contrast, recessions were induced by a tightening of monetary policy to bring inflation under control. Because financial institutions were more heavily regulated there was less financial instability. Inflation was the chief yardstick for judging the sustainability of economic expansions, as opposed to financial imbalances. A combination of the pandemic and the war in Ukraine has created economic circumstances very similar to the late 20th century. But thanks to financial liberalisation the scope for financial upsets in a monetary tightening cycle is much greater, as the collapse of Silicon Valley Bank and others showed last year. How much more financial vulnerability might be exposed in this cycle is an open question. Because of the long period of ultra-low interest rates since the 2008 financial crisis, much private sector borrowing has been at fixed rates and long maturities, so credit stress from the sharp interest rate rises of the past two years has been delayed. And then there is huge uncertainty around the extent of risk taking in the burgeoning non-bank financial sector. There are nonetheless grounds for regarding the setback in equities as a healthy correction. Market buoyancy this year has been overdependent on hype around artificial intelligence in the so-called Magnificent Seven tech stocks. Note that Elroy Dimson, Paul Marsh and Mike Staunton in the UBS Global Investment Returns Yearbooks have established that over more than a century investors have placed too high an initial value on new technologies, overvaluing the new and undervaluing the old.
The research that Plender is referring to, is the annual Investment Returns Yearbook by Elroy Dimson, Paul Marsh and Mike Staunton. Back in 2015 they subjected the case for all-in tech investing, to skeptical examination. Looking back from 2024, at their analysis in 2015 is a salutary reminder of how shocking the dot.com collapse was.
Taking an even longer view, the latest edition of the Yearbook for 2024 is a treasure trove of data on global equity (and bond) markets over the last 125 years. With the kind permission of the authors, I am happy to share some of the nuggets on equity markets here. I will come back to the bond market discussion in another post.
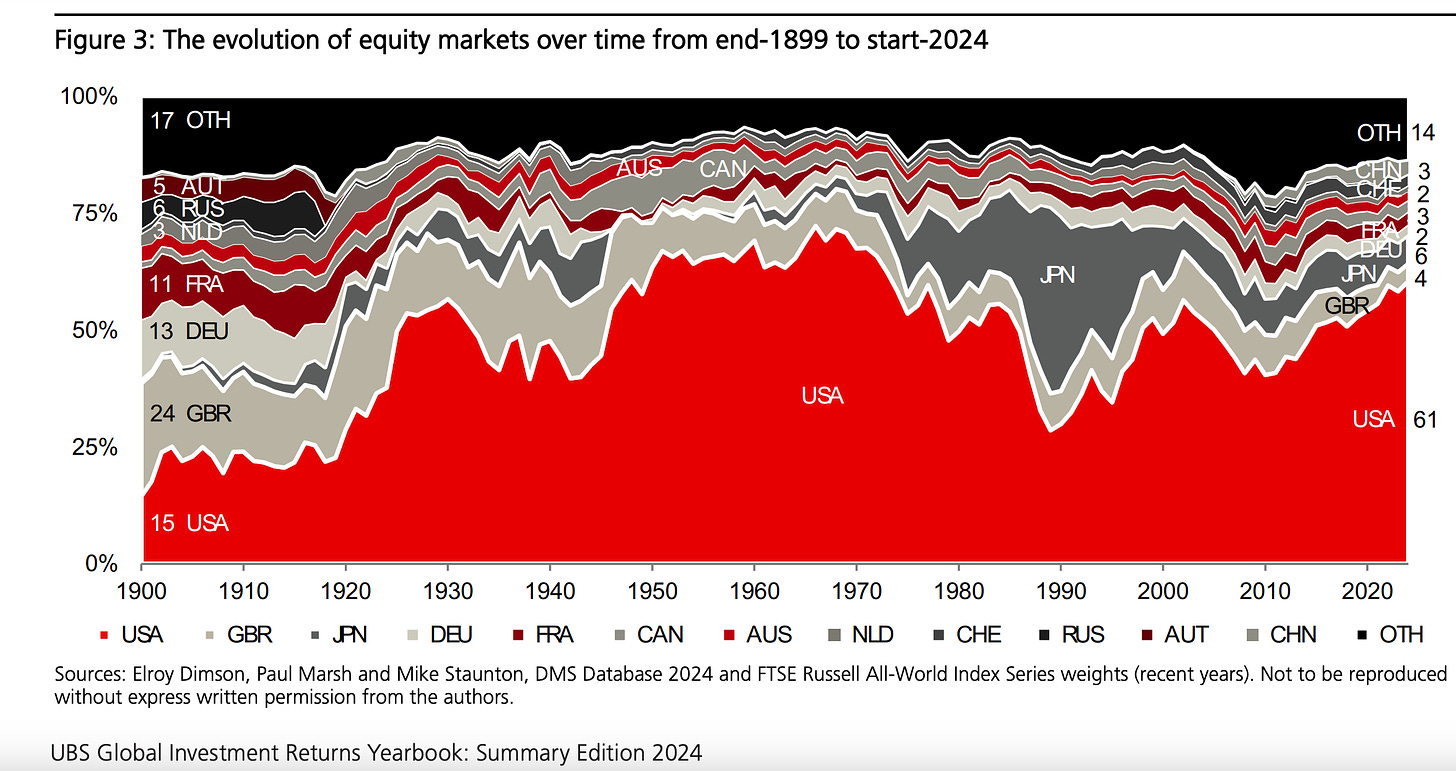
It is a truism of the current world that the US equity market dominates the world. The Yearbook data put this in perspective.
Copyright © 2024 Elroy Dimson, Paul Marsh and Mike Staunton
As I have been tracing in the hegemony notes series, World War I shifted the financial center of the world away from Europe to the US. After World War II the US became absolutely dominant. The preeminence of the US today in terms of the valuation of its equity market is, in fact, less pronounced than it was in the 1950s and 1960s. Even taken as a bloc, equity markets in continental Europe have never come close to rivaling the US in the post 1945 period. The big swings have come from the long-run decline of the City of London, and the boom and bust in Japan which squeezed the US share in the 1970s and 1980s and then imploded.
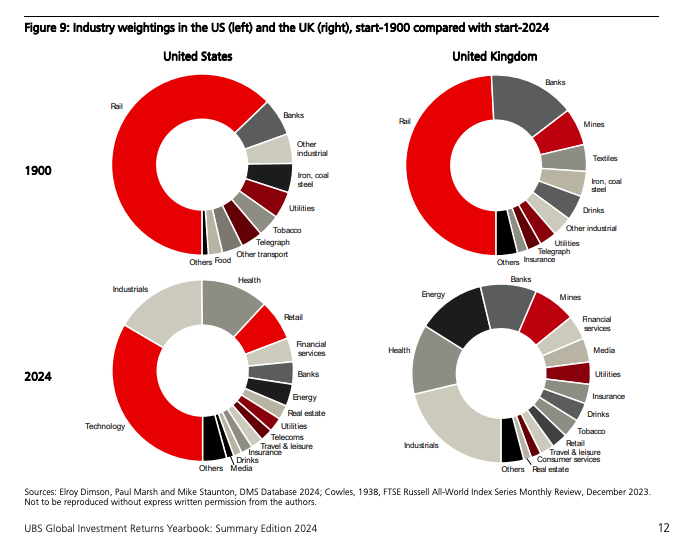
Within the composition of these markets there has been a dramatic sectoral shift.
Copyright © 2024 Elroy Dimson, Paul Marsh and Mike Staunton
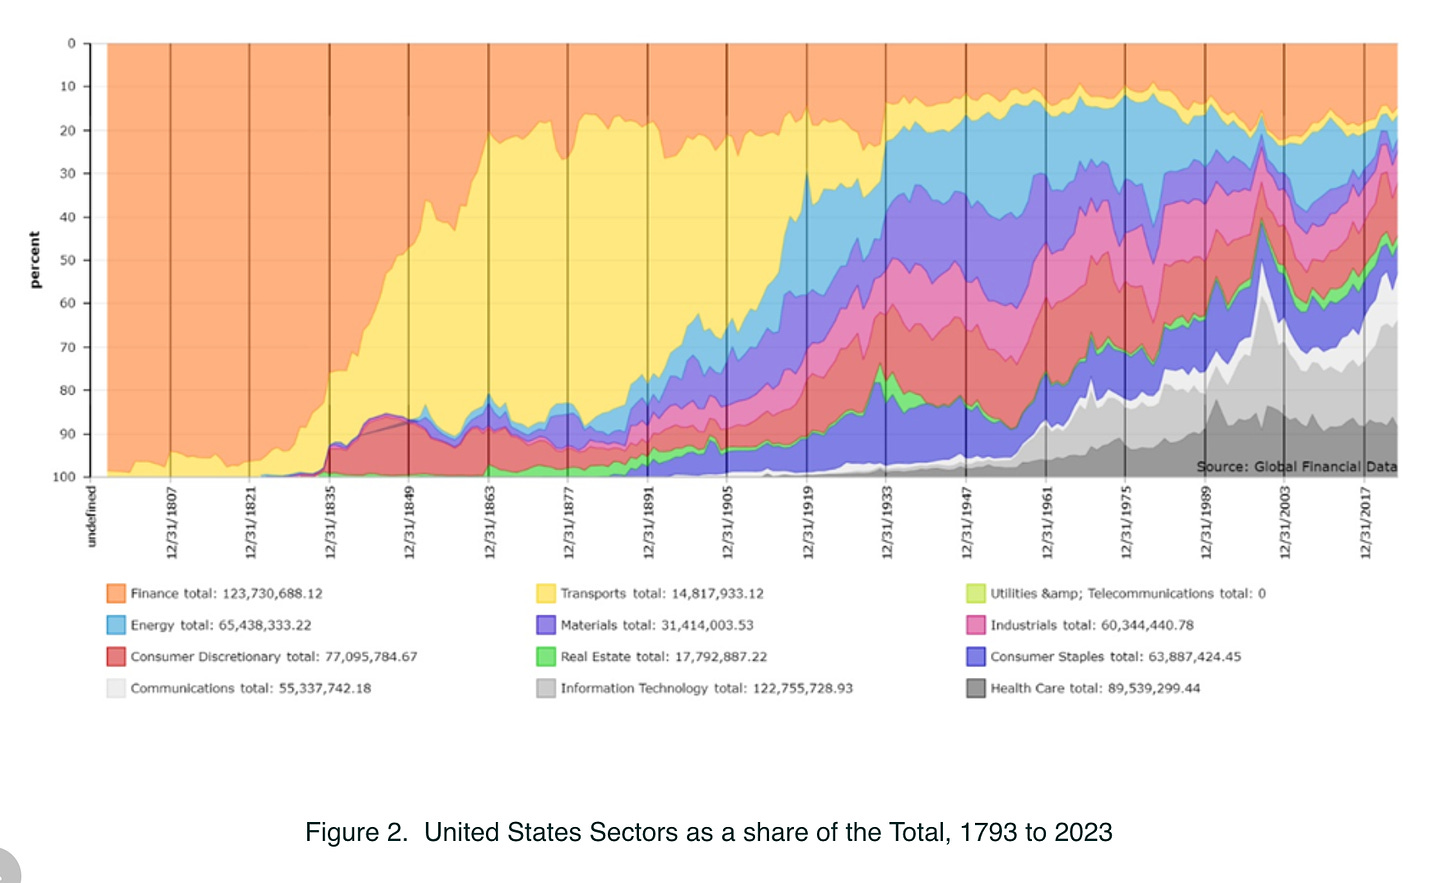
It is hard to exaggerate the extent to which equity markets in the late nineteenth and early twentieth centuries were about railway construction and industrialization. Before that they were about banks. For all the talk of the dominance of tech, markets today are far more diversified than they were in 1900. Here are the data for US markets through 2023.
Source: Taylor Global Financial Data
The light grey wedge at the bottom is clearly the most rapidly growing piece of US markets. But it is just one component of a diversified range of stocks.
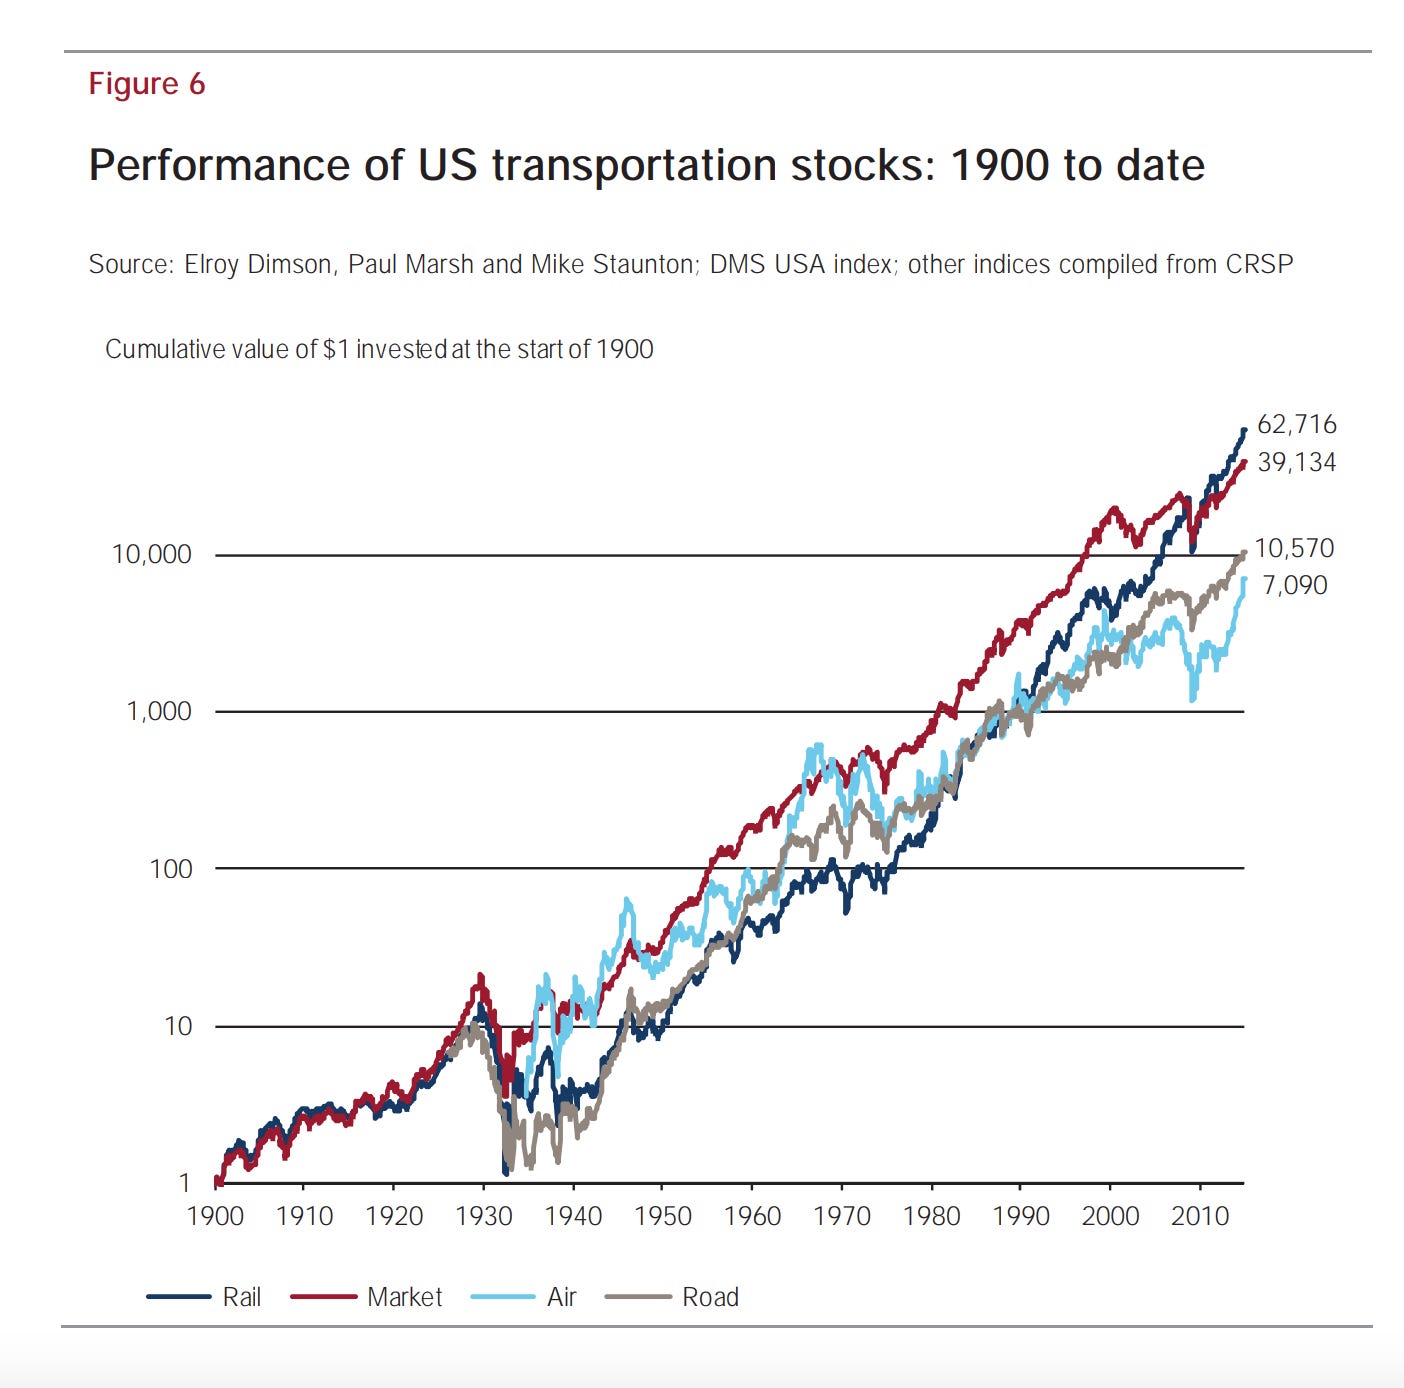
Obviously, railway stocks are no longer a dominant component of the US equity markets. But railways still form an essential part of US freight logistics, especially for bulk commodities. And you can still buy railway stock. Famously, in 2007 Warren Buffett started buying up Burlington Northern Santa Fe (BNSF). And as Dimson, March and Staunton showed back in 2015, if you had bought a railway portfolio in 1900 and stayed invested, you would have made spectacular returns, outperforming the market as a whole and leaving airline and trucking companies in the dust.
Source: Investment Returns Handbook 2015
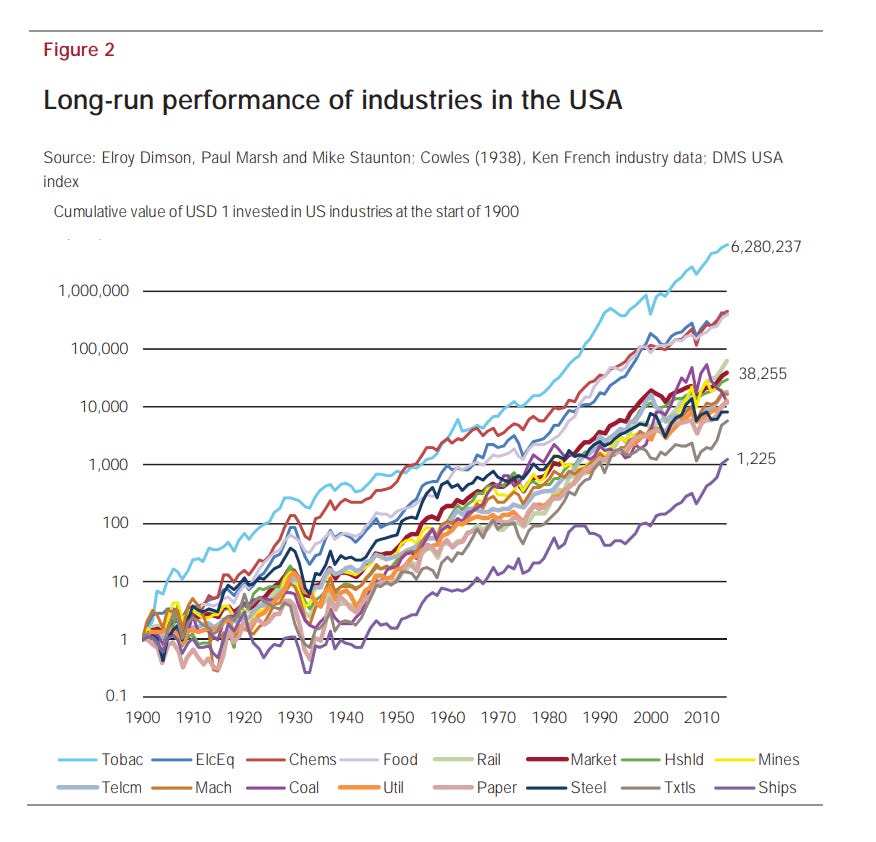
If in 1900 you had invested in big tobacco, you would have gone to the moon. A buy and hold strategy in electrical equipment, chemicals and major food brands would also have done brilliantly well.
Source: Investment Returns Handbook 2015
Their point was that a strategy of buying solid stocks and holding them in the long-run, even if you invested in “old sectors” was likely to yield as good, if not better returns than chasing the latest technological fad. That, at least, is how I read the message of the 2015 report.
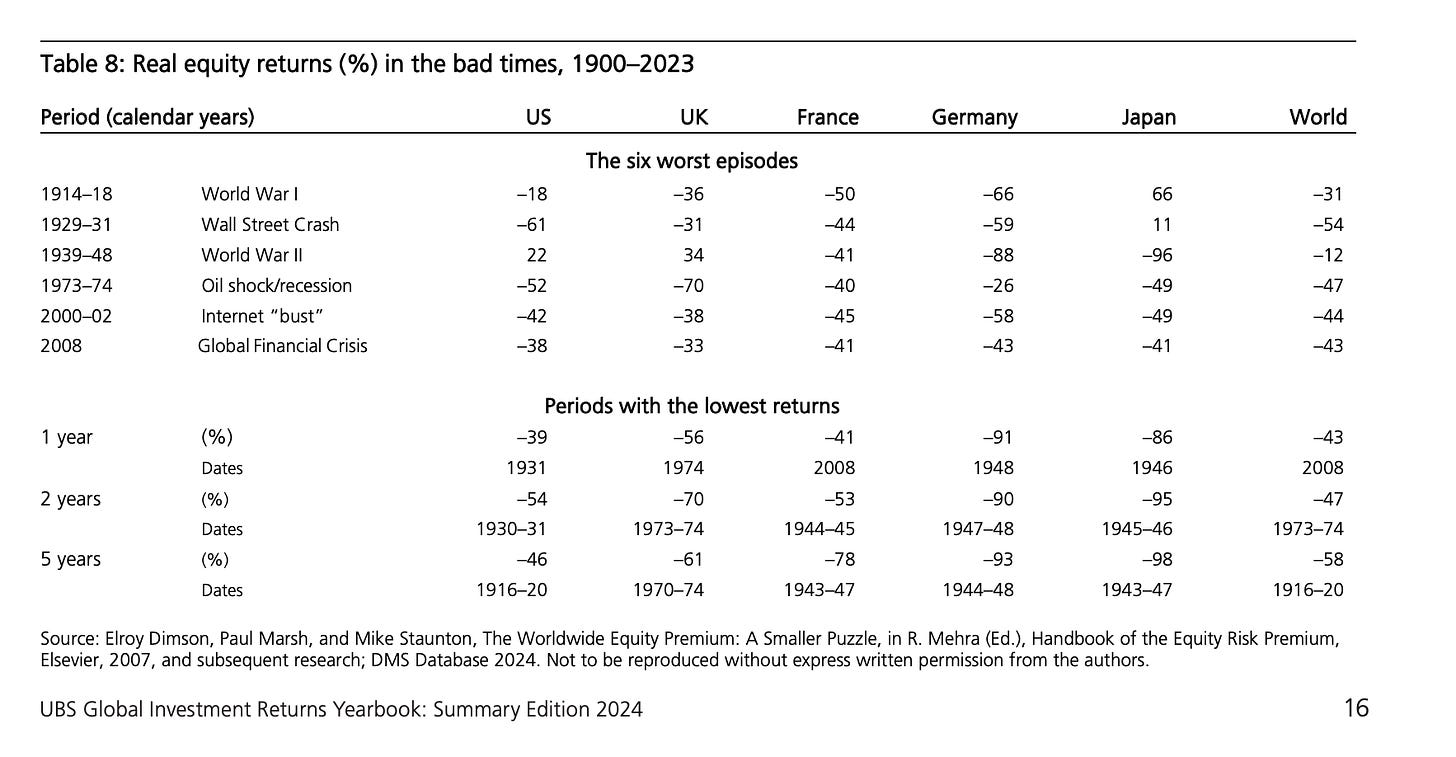
Of course, investing in stock markets comes with risks. Timing makes all the difference. As Elroy Dimson, Paul Marsh and Mike Staunton show, though the overall trend is up over the long run, major equity markets around the world have suffered from several prolonged phases of losses. I am reminded by this chart once again of the way in which the dot.com bust of the early 2000s was not confined to the US, but triggered an extraordinarily heavy sell-off in Germany too.
Copyright © 2024 Elroy Dimson, Paul Marsh and Mike Staunton
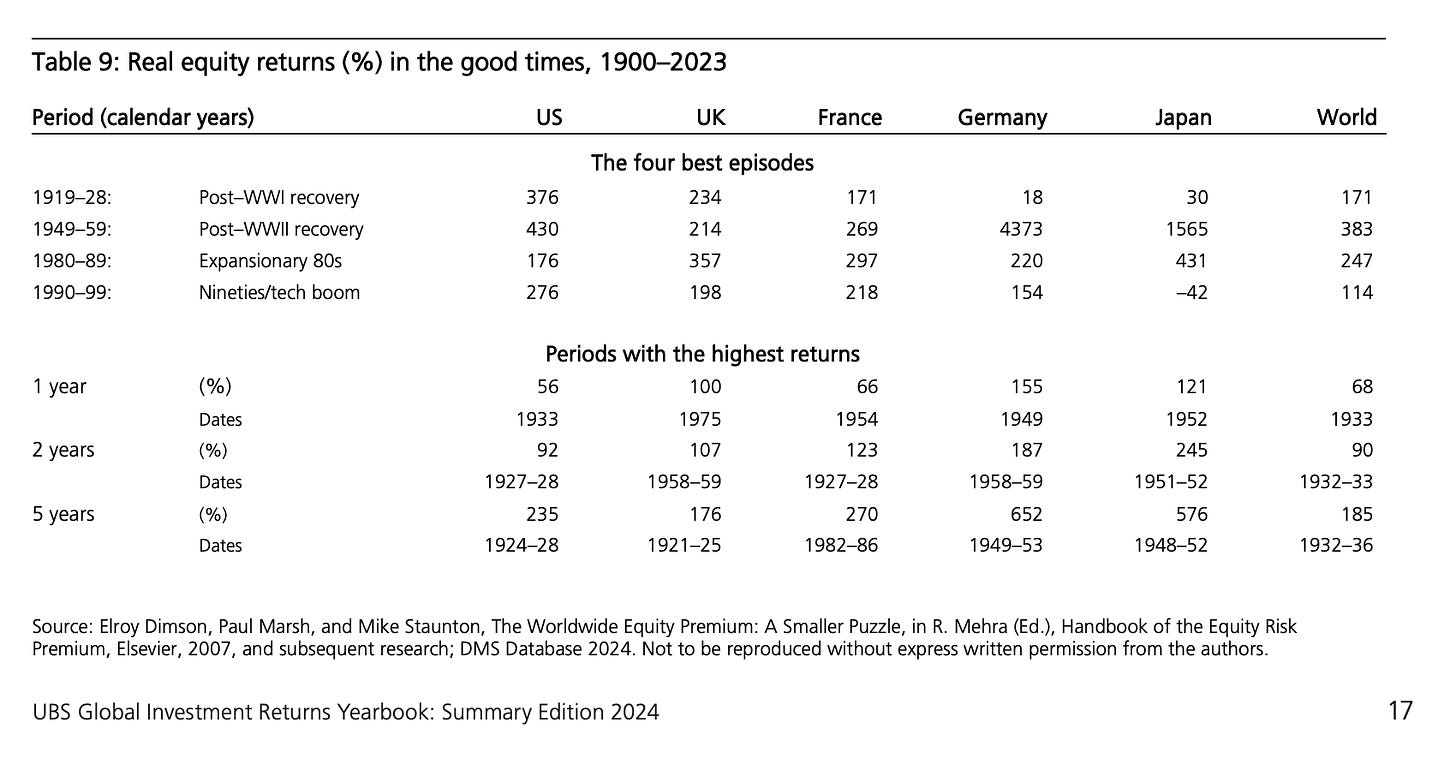
And then there are the good times. Note again, how the current rebounds do not feature in this short list of the four best episodes in the history of the US stock market. The huge surge in US equity values between 1949 and 1959 is interesting, underpinning as it did the dominance of US markets in the postwar era.
Copyright © 2024 Elroy Dimson, Paul Marsh and Mike Staunton
In the modern world of “financialized” equity markets, the underlying index provides the basis for hugely elaborate derivatives products. Many of these are keyed to volatility.
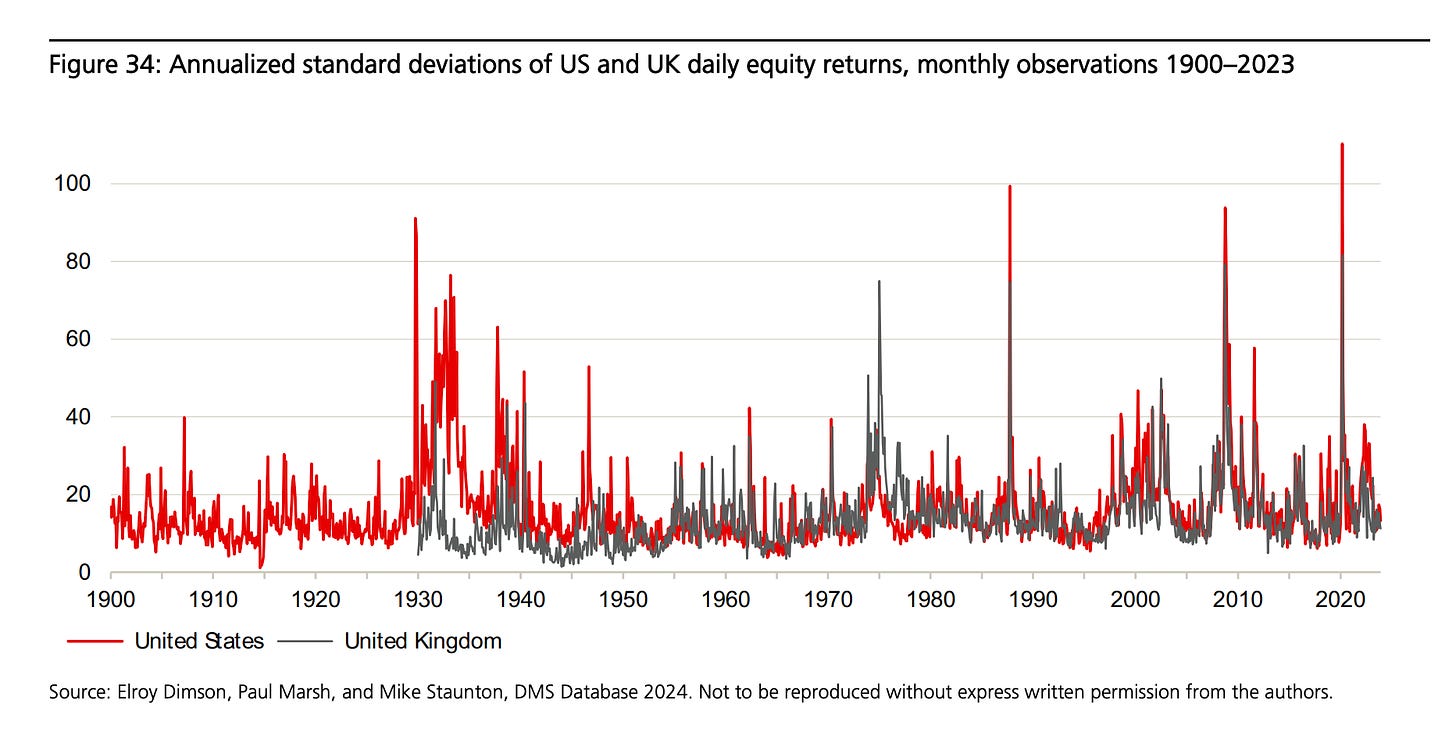
Volatility has been much in the news in recent weeks. Until the last week or so we seemed to live in a world in which intense spikes in uncertainty oscillated with phases of eerie calm. And, again, the long-run data put this in perspective. In this case, however, rather than de-dramatizing the present, 125 years of data confirm how significant the recent spikes in volatility have been. The swings in prices in 2020 and 2008 are notable, as is the relative calm in between.
Copyright © 2024 Elroy Dimson, Paul Marsh and Mike Staunton
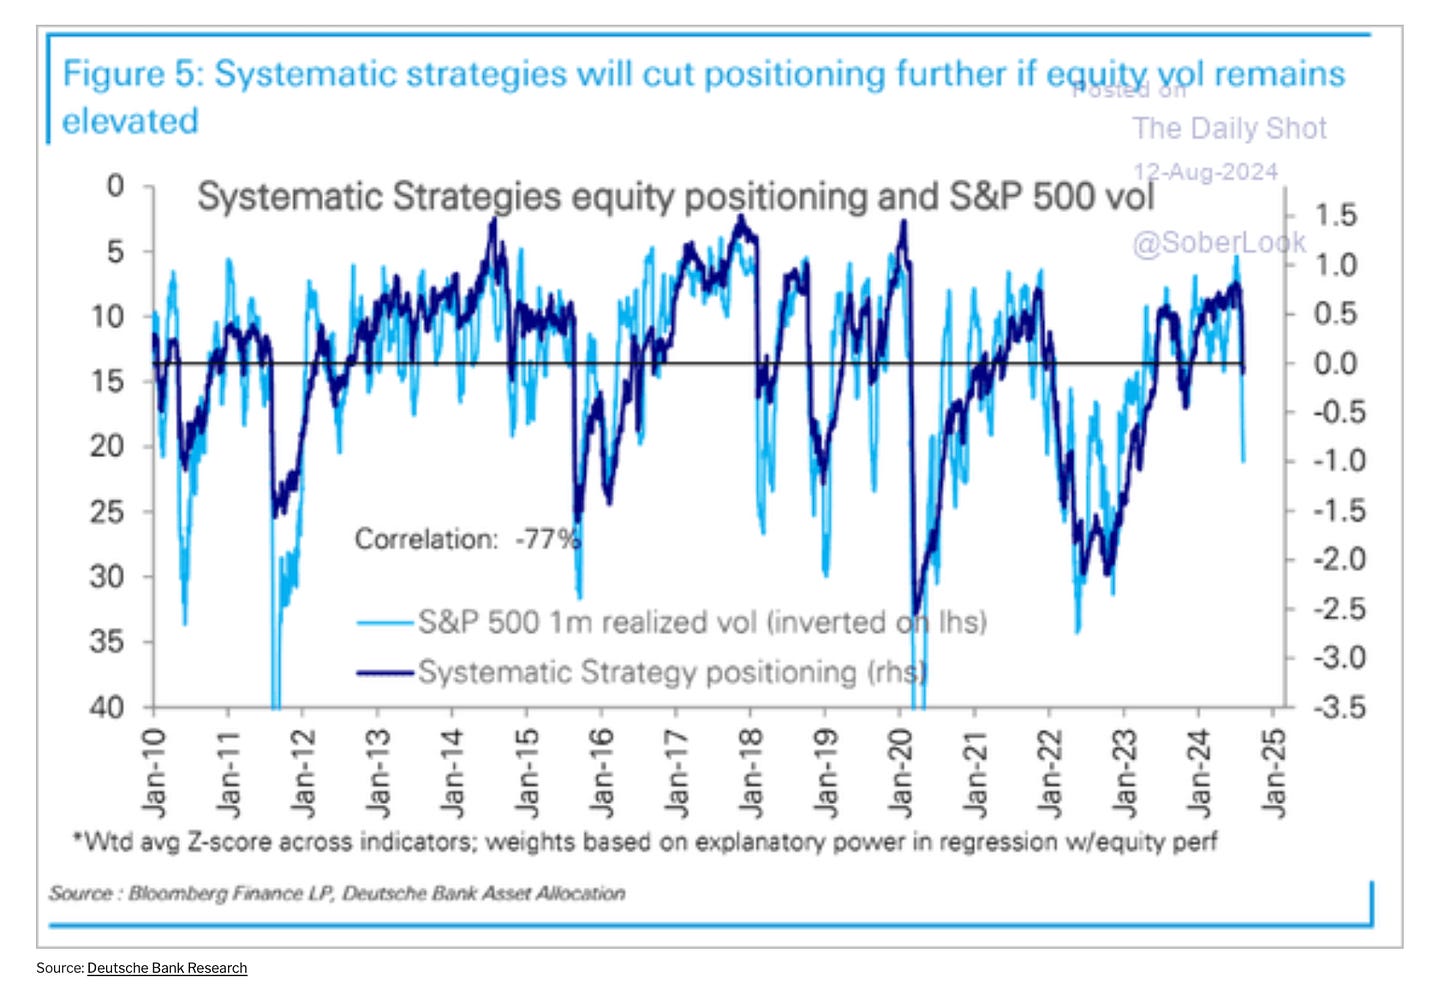
Investors placed bets not just on shares but on the prospect of low volatility persisting. Meanwhile, as Deutsche Bank research shows, systematic strategies piled money into equities as volatility declined.
What we have been experiencing in the last few weeks is what happens when those trades unwind. When volatility rises above a threshold money gets pulled from the market. Potentially this creates a destabilizing feedback loop, in which a “vol event” triggers a sell off, which compounds the volatility. Of course, this also creates opportunities for investors who are willing to buy the dip, which is what we have also seen in the last ten days.
What these feedback loops do, is to add reflexivity to the world that Plender describes in his column. It is not just that the change in monetary policy stance in the US, Japan and elsewhere, shifts the parameters for financial market trades and forces adjustment. Many of those trades anticipate the possibility of such a shift and have trigger clauses set to react accordingly. In other words, key parts of the “system” anticipate its sensitivity to new information in the hope of being able to avoid losses or even make gains. Whether or not that is possible and whether or not the ensemble of trades is stable, is the question that is being put to the test.
I love writing Chartbook. I am delighted that it goes out for free to tens of thousands of readers around the world. In an exciting new initiative we have launched a Chinese edition of Chartbook, on which more in a later note. What supports this activity are the generous donations of active subscribers. Click the button below to see the standard subscription rates. I keep those rates as low as substack allows, to ensure that backing Chartbook costs no more than a single cup of Starbucks per month. If you can swing it, your support would be much appreciated.


Some really interesting charts.
Caution is advised for sweeping conclusions on equities.
First, look at countries without their inevestability haircuts as well as the indexers numbers. Sure., some are SOEs that don't even act like public companies - but many do. Will we see more of EM business end up in the float? Odds are decent that we will, though momentum has obviously slowed.
The 100 year charts, with typical sector definitions and float restrictions, is probably more noise than signal. Sears. GE, IBM, Avon, Chrysler, TRW, Seagate - were a few of the °solid buy & hold° companies I worked with. But the internet happened and solids started melting.
For me - base years< 30 years ago, to around 1994 are the signal. Dale Jorgenson and Bob Gordon can hugely inform the analysis then, too. Trying KLEMS industry classifications (globally if complete) or Damodaran's would also be interesting.
Google and Facebook are advertising, Amazon is retail, Microsoft is enterprise software, Tesla is battery. All with embedded real options on AI. But also with embedded social licenses (about as costly as cable licenses once were, i.e. free) which allow them to ubiquitously mine (along with their global brethren) choices of most humans on the planet. NFL and NBA rights, denovo big budget movie studios - who can outbid the monetization monsters? Andreeson said software would eat the world. Sorta right. MONETIZATION MONSTERS SANS GUARDRAILS own the buffet now. If tech was going to sell to other industries to boost their customers productivity (a 90's theory) the sector charts you showed would make more sense. But tech is still eating their prospective customers.
In short, the devil is in the details when equity strategizing. People like the now deceased Barton Biggs and Byron Wein embraced this. But power today is in indexers, quants, and algo's. A long way of saying - the story of what the internet/Ai will do to equity markets, returns, sectors, Em's, and productivity…is too uncertain for century long extrapolations. But it sure is fascinating to imagine where it's going!