Inflation drivers, giant squids & the global gemstone market
Great reading, links and images from Chartbook Newsletter by Adam Tooze
I love sending the newsletter for free to thousands of readers around the world. But what sustains the effort are voluntary subscriptions from paying supporters. If you are enjoying the newsletter and would like to join the group of supporters, press this button and pick one of the three options.
Several times per week, paying subscribers to the Newsletter receive the full Top Links email with great links, reading and images.
There are three subscription models:
The annual subscription: $50 annually
The standard monthly subscription: $5 monthly - which gives you a bit more flexibility.
Founders club:$ 120 annually, or another amount at your discretion - for those who really love Chartbook Newsletter, or read it in a professional setting in which you regularly pay for subscriptions, please consider signing up for the Founders Club.
When an offensive really is an offensive and not an “attack” or a “counteroffensive”
For subscribers
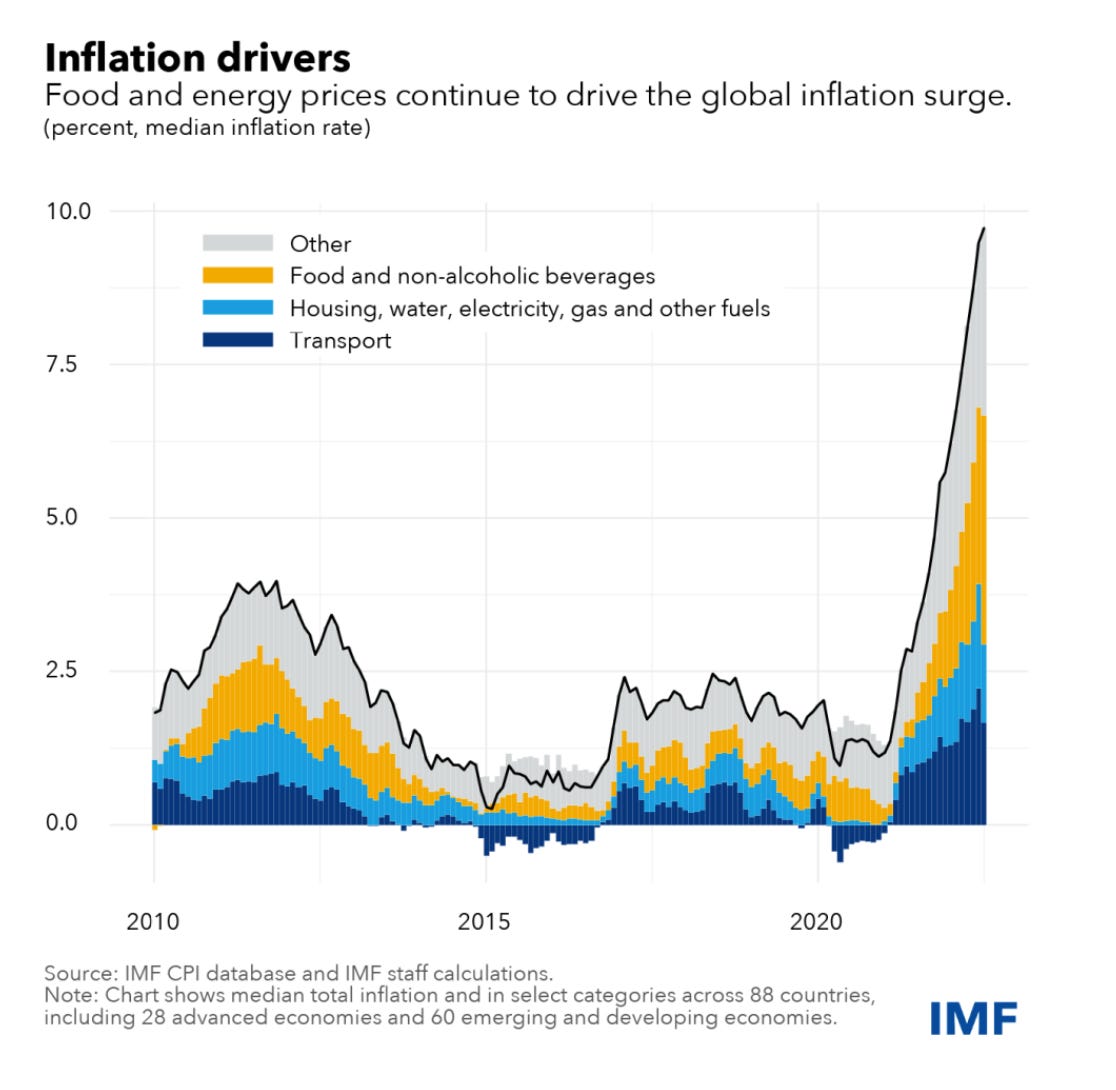
Inflation drivers
Food and energy are the main drivers of this inflation, as our Chart of the Week shows. Indeed, since the start of last year, the average contributions just from food exceed the overall average rate of inflation during 2016-2020. In other words, food inflation alone has eroded global living standards at the same rate as inflation of all consumption did in the five years immediately before the pandemic. A similar story holds for energy costs, which show up both directly and indirectly, through higher transportation costs. This is not to say that prices of other items are not rising too. For example, services inflation has increased in the United States and the euro area. And the relative impact of food, energy, and other items in driving inflation varies considerably across countries.
Source: IMF Blog
Winners and Losers from the Global Energy Price Shock
For subscribers
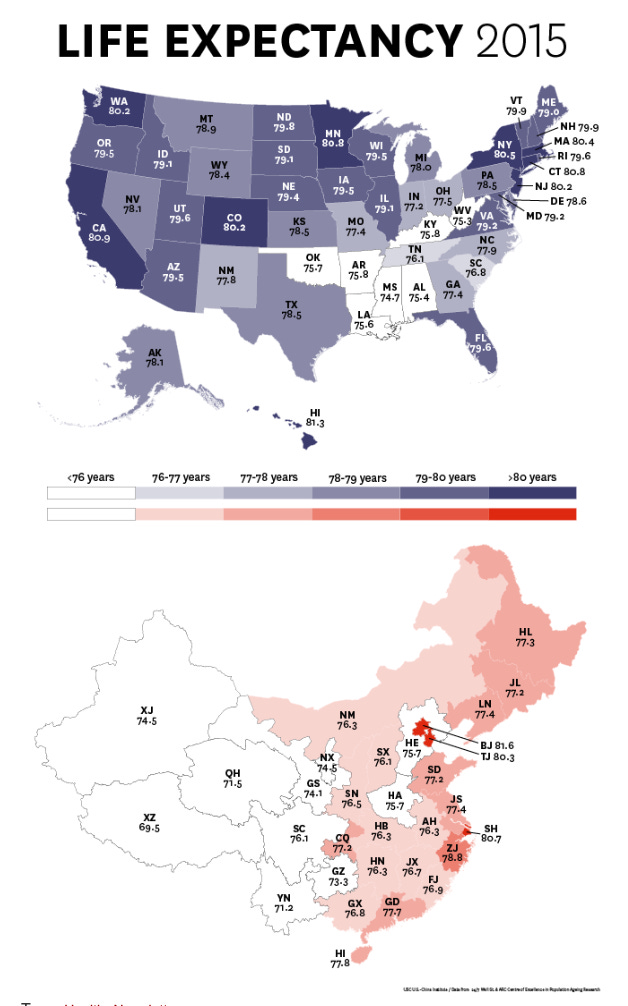
Life expectancy in the USA and China varies considerably across regions
Source: China USC
Gemstone supply chains
”The number of global jewellery events that took place over the summer was the strongest indicator that the industry is returning to its pre-pandemic rhythm. However, for many jewellers, gems that featured in this year’s high-end pieces had been sourced long before the outbreak of Covid-19. These gems came from consignments bought before the imposition of lockdowns, or from existing stock stowed for years in the safes of jewellery houses. But, even for jewellers with ample reserves, the pandemic highlighted the precarious nature of the supply chains for colour gemstones. Unlike diamonds, which have standardised characteristics and clarity of pricing, given they make up 80 per cent of the jewellery business, colour gemstones are a multi-faceted world of their own. Each gemstone — of which there can be myriad sources — has its own idiosyncratic supply chain, each disrupted in different ways during the pandemic. … One jeweller known for its lavish colour gemstones is Bulgari, which has launched the Eden Garden of Wonders collection brimming with thousands of exotic stones. Its creative director, Lucia Silvestri, started collecting the emeralds used “three to four years ago, waiting for the right moment to come”. With mines being depleted and new sources of gemstones few and far between, the practice of basing designs around the availability of the stones themselves is sure to continue — and even increase.”
Fascinating this by Maria Doulton in the FT
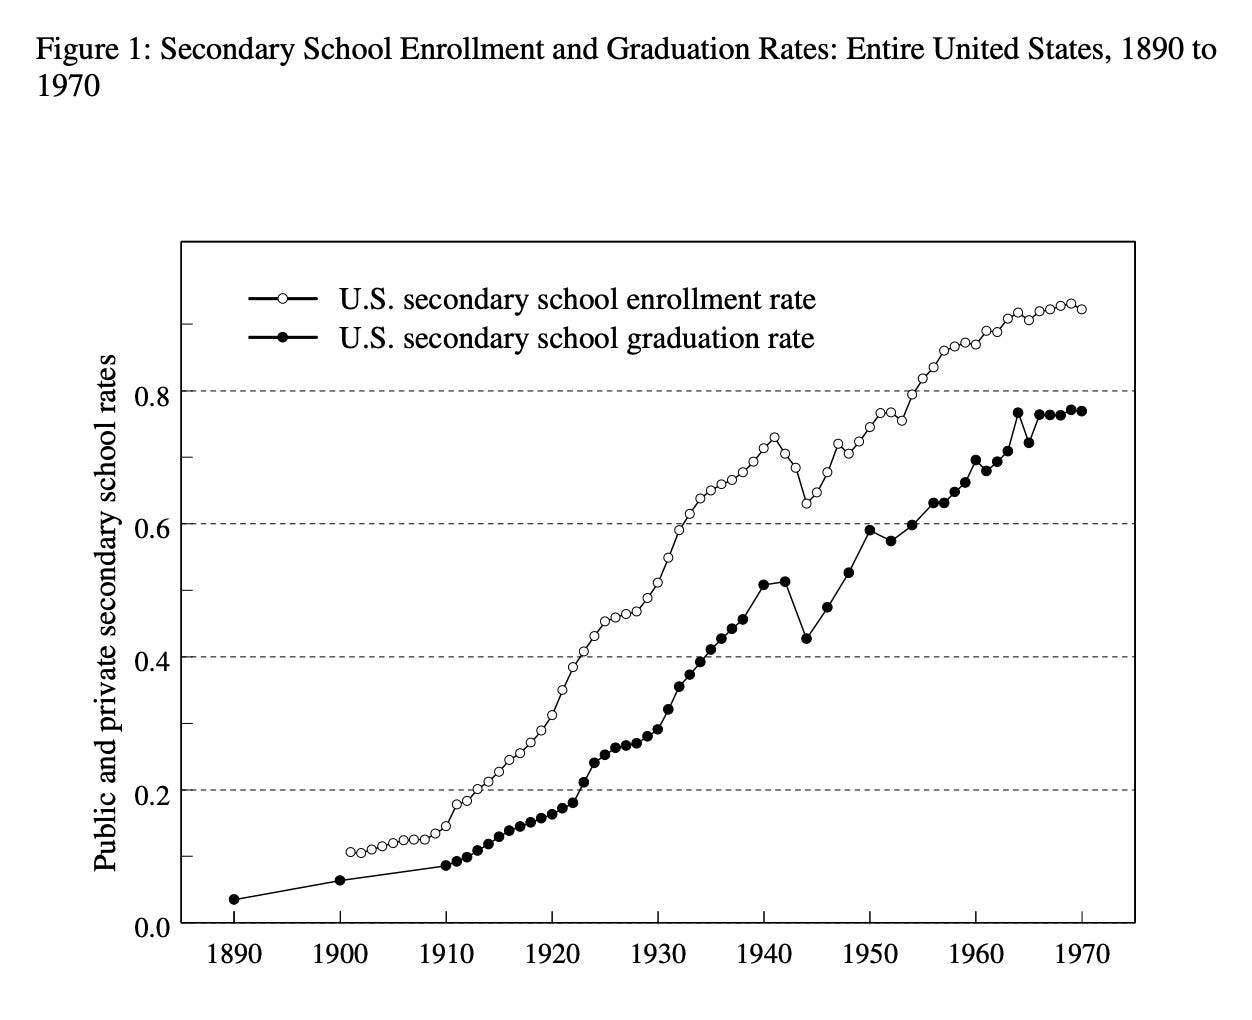
“Why the United States Led in Education: Lessons from Secondary School Expansion, 1910 to 1940”, Claudia Goldin Harvard University and the NBER and Lawrence F. Katz Harvard University and the NBER 2008
“In the first several decades of the twentieth century, the United States pulled far ahead of all other countries in the education of its youth. It underwent what was then and now termed the “high school movement,” a feat most other western nations would achieve some 30 to 50 years later. We address how the “second transformation” of American education occurred and what aspects of the society, economy, and political structure enabled the United States to lead the world in education for much of the twentieth century. 1 From 1910 to 1940, America underwent a spectacular educational transformation. Just 9 percent of 18-year olds had high school diplomas in 1910, but more than 50 percent did by 1940 (see Figure 1). The transformation was even more rapid in many non-southern states and cities. Secondary-school enrollment and graduation rates, in most northern and western states, increased so rapidly that by the mid-1930s rates were as high as they would be by 1960. The high school movement set the United States far ahead of all other nations in its human capital stock. 2 Earlier in its history, the United States had also taken a commanding position in education. During the mid-nineteenth century, America surpassed the impressive enrollment levels achieved in Germany and took the lead in primary (grammar, elementary, or common) school education (Easterlin 1981). But by the turn of the twentieth century, various European countries had narrowed their educational gap with the United States (Lindert 2004). As the high school movement took root in America, however, the wide educational lead of the United States reappeared and was expanded considerably to mid-century. Educational differences between youths in the United States and those in many European countries would not again be reduced for some time and in many cases have been narrowed only 2 recently. Differences in formal schooling rates for older youths (15 to 19 years old) between various European countries and the United States were substantial in the mid-1950s. 3 As can be seen in Figure 2, the U.S. secondary school enrollment rate for older youths in 1955 was just below 80 percent. No European country, however, had a full-time general schooling rate for youths in this age bracket exceeding 25 percent. These substantial differences in full-time formal schooling are only slightly reduced by including youths enrolled in full-time technical programs (the two bottom portions of the histogram bar). With this addition, no European country had a general and technical full-time enrollment rate exceeding 40 percent. To make the point even more extreme, the wide U.S. lead in education remains even after including for those in part-time technical programs (the entire histogram bar). The relative stock of educated workers, therefore, was considerably greater in the United States than in most European countries until the 1970s and even to the 1980”
Very 2022 … and still relevant..
For subscribers
The man who made table tennis into China’s national sport


Delia Derbyshire, electronic music pioneer
For subscribers only.
Reggie Burrows Hodges "Intersection of Color: Experience" recently went for $560k


