How US arrivistes do it better. Exceptionalism weighed. Sino-Saudi ties. The global cotton boom and slavery in Egypt.
Great links, images, and reading from Chartbook Newsletter by Adam Tooze
Thank you for opening your Chartbook email.
David Salle THE WIG SHOP, 1987. OIL AND ACRYLIC ON CANVAS. 78 X 96 INCHES. IMAGE COURTESY OF DAVID SALLE. Source: Interview Magazine
US exceptionalism and the arrivistes
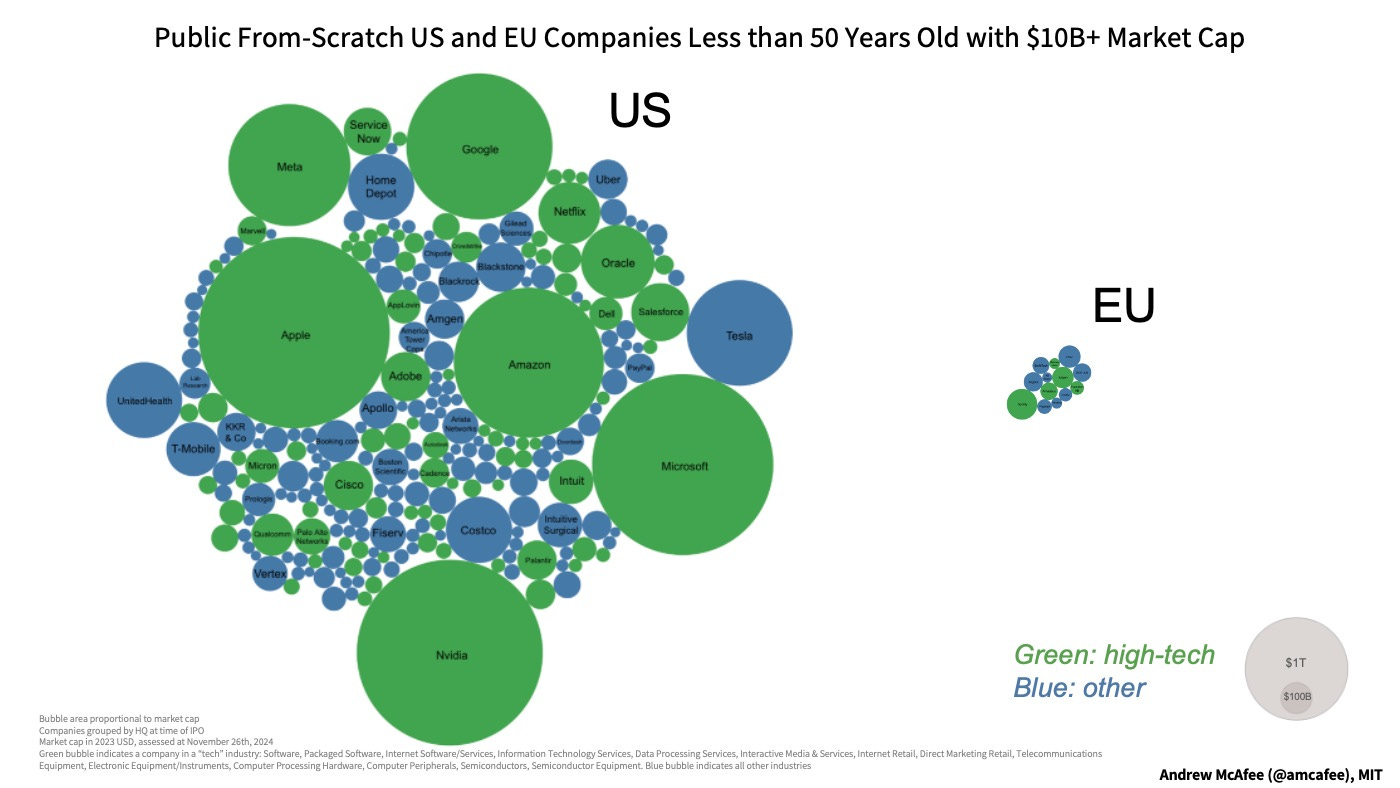
Of all the chiffres justes in the report, though, the ones that most startled me were in this sentence: “there is no EU company with a market capitalisation over EUR 100 billion that has been set up from scratch in the last fifty years, while all six US companies with a valuation above EUR 1 trillion have been created in this period.” This sentence rises not to the level of art or literature, but instead showbiz: it leaves the reader wanting more. It tells us that Europe has no from-scratch companies founded in the past fifty years — let’s call such companies arrivistes — worth a hundred billion, but is silent on just how many US arrivistes are over that bar. Also, how many are below that bar, but still sizable? If we lower the threshold by a factor of 10, what do we learn? How many arriviste European companies are worth at least $10B (I’m switching from euros to dollars here)? … Like the rest of the Draghi report, it's not a pretty picture for Europe. … When assembling this visualization, we followed Draghi's definition of a from-scratch company. ““From scratch” refers to starting a company from its inception as a new entity, rather than through mergers, acquisitions or spinoffs from established firms.” We also considered only publicly-traded companies (since the report specifies “market capitalisation,” not private valuation). … We found 13 EU arrivistes worth at least $10B (But we may have missed some, even though we combed through the Factset data pretty carefully; here are our data. If you know of a company that meets the Draghi criteria but is not in the picture above, please let me know.). The total market cap of this continental treize is about $400B.
On one hand, $400B is a lot of money. On the other, it's less than half of a Tesla today1, and less than 1/8 of an Apple or Nvidia. The biggest American arrivistes are staggeringly big. As Draghi points out, it's not great that Europe doesn't have any companies near their size. But it's even worse that compared to the US, the EU has so few chances at creating the next giant arrivistes. I feel like I should give a trigger warning at this point to Europe's tech and competitiveness boosters: the data visualization they're about to see is not kind to their hopes and dreams. Here’s the Euro treize again, this time next to the equivalent US cluster: all American public arrivistes worth at least $10B:
The US has a large and variegated population of valuable young from-scratch companies. The EU simply doesn’t. The American population of arrivistes worth at least $10B is collectively worth almost $30 trillion dollars — more than 70 times as much as its EU equivalent.
Source: The Geek Way by Andrew McAfee
Martin Wolf weighs American exceptionalism
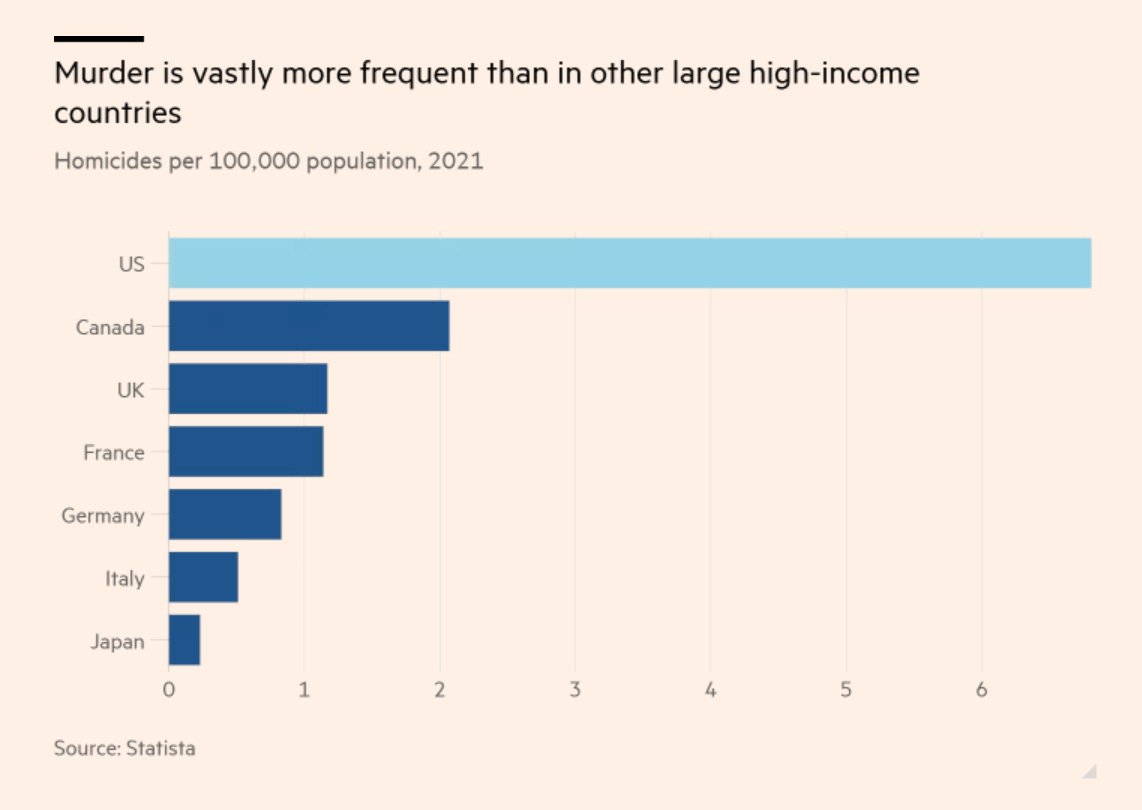
The most telling indicator of a people’s welfare is life expectancy. US life expectancy is forecast at 79.5 years for both sexes this year. This makes it 48th in the world. China’s life expectancy is forecast to be almost as high, at 78. UK and German life expectancy is 81.5, French 83.5, Italy’s 83.9 and Japan’s 84.9. Yet the US spends far more on health, relative to GDP, than any other country. This shows great wastefulness, though this low US life expectancy has a number of additional explanations. Yet, what does the high measured US GDP mean if some 17 per cent was spent on health, with such poor results? More broadly, what does US prosperity mean when combined with such potent indicators of low welfare? These outcomes are the result of high inequality, poor personal choices and crazy social ones. Some 400mn guns are apparently in circulation. This surely is insane.
Source: Financial Times
HEY READERS,
THANK YOU for opening the Chartbook email. I hope it brightens your weekend.
I enjoy putting out the newsletter, but tbh what keeps this flow going is the generosity of those readers who clicked the subscription button.
If you are a regular reader of long-form Chartbook and Chartbook Top Links, or just enthusiastic about the project, why not think about joining that group? Chip in the equivalent of one cup of coffee per month and help to keep this flow of excellent content coming.
If you are persuaded to click, please consider the annual subscription of $50. It is both better value for you and a much better deal for me, as it involves only one credit card charge. Why feed the payments companies if we don’t have to!
And when you sign up, there are no more irritating “paywalls”
GM to Exit Michigan EV Battery Plant
For contributing subscribers only.
Sino-Saudi relations deepen
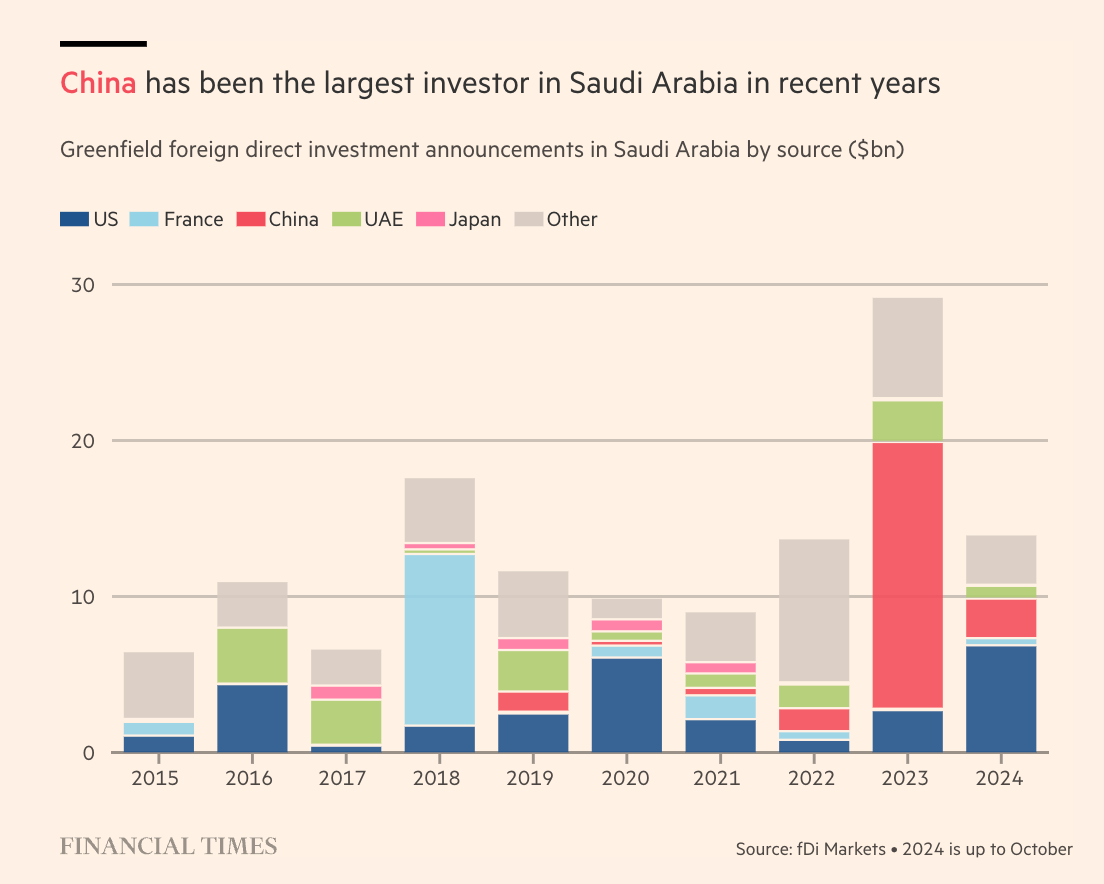
Chinese exports and investment are pouring into Saudi Arabia as the kingdom’s demand for green tech deepens a relationship once defined by oil sales and challenges business ties with its traditional western partners. Bilateral trade has for many years been almost totally dominated by Chinese purchases of Saudi oil. But now, Chinese exports to Saudi Arabia are tracking towards a record high, at $40.2bn in the first 10 months of the year, up from $34.9bn for the same period last year, according to Chinese government data. China has also become the kingdom’s largest source of greenfield foreign direct investment, with investments from 2021 to October this year totalling $21.6bn, about a third of which were in clean technologies such as batteries, solar and wind, according to investments tracked by fDi Markets. This compares with $12.5bn from the US, the next highest. The figures herald a sea change, with China eclipsing the kingdom’s traditional investment partners, the US and France. Many of the Chinese deals have yet to show up in official Saudi figures, indicating the capital has yet to be deployed
Saudi investment in China’s oil and gas industry as well as Chinese investment in the Saudi renewable energy sector is powering the expansion of trade. Ken Liu, head of China renewables, utilities and energy research at UBS, forecasts $432bn in additional energy-related annual trade between the Middle East and China by 2030. There has been a flurry of new deals in recent months highlighting the deepening ties. Backed by Saudi investment, ageing Chinese oil refineries are diversifying towards more downstream petrochemical products including diesel, methanol and ammonia. Saudi Aramco in September expanded its Chinese refinery and chemical partnerships with Rongsheng and Hengli, two of China’s biggest petrochemical groups. Saudi Aramco also announced a plan with China National Building Material Group to build clean tech manufacturing facilities in Saudi Arabia. Investment group EWPartners, which is backed by the kingdom’s sovereign wealth fund PIF, in mid-October announced a $2bn plan for a so-called KSA-Sino special economic zone at Riyadh’s King Salman International Airport and for more Chinese companies to localise manufacturing there.
Source: Financial Times
David Salle FALSE QUEEN, 1992. OIL AND ACRYLIC WITH OBJECTS ON CANVAS. 96 X 72 INCHES. IMAGE COURTESY OF DAVID SALLE.
Why count bank notes?
For contributing subscribers only.
This tracker of Elon Musk’s Starlink satellites is truly a sublime spectacle. How did this happen?
Source: Satellite Map
Trade, Slavery, and State Coercion of Labor: Egypt during the First Globalization Era, by Mohamed Saleh
Ample empirical evidence indicates that trade booms can increase labor coercion. Rising grain exports have long been used to explain the Second Serfdom in Eastern Europe (Małowist Reference Małowist1958; Guzowski Reference Guzowski2011). The rising demand for coercion during trade booms has also been documented during the nineteenth century for Britain (Naidu and Yuchtman Reference Naidu and Yuchtman2013), Puerto Rico (Bobonis and Morrow Reference Bobonis and Morrow2014), and the British West Indies (Dippel, Greif, and Trefler Reference Dippel, Greif and Trefler2020). However, this literature largely focused on a single system of coercion: slavery in the Americas or serfdom in Europe. Yet, multiple coercive systems often coexisted. Slavery and serfdom coexisted in Russia until the eighteenth century (Hellie Reference Hellie, Eltis and Stanley2011), and indentured servitude of European immigrants long coexisted with black slavery in the Americas (Galenson Reference Galenson1984). The implications of trade booms under such dual-coercive environments are the focus of this article.
Specifically, this article investigates the effects of trade booms on labor coercion under the dual-coercion environment of slavery and state coercion. It focuses on the environment where slaves were imported from abroad, whereas local workers, who were recruited freely on the market, could not be enslaved but may have been subject to state coercion. Conceptually, trade booms may have different implications under dual-coercive systems. Within single-coercion environments, employers face a common labor supply and have access to a common coercive technology. However, under dual-coercive systems, labor supply and access to coercive systems may differ across employers. While all employers have access to foreign slaves sold in local slave markets, state coercion—like serfdom—is limited to the political elite, who can use state violence to coerce local workers, taking them out of the free labor market. This implies that slavery and state coercion are interdependent. The trade boom-induced rise in state coercion by the elite reduces the free local labor supply that faces non-elite landholders, inducing them to purchase more foreign slaves than under the slavery-only environment. In a similar vein, the abolition of slavery can exacerbate state coercion as the elite coerce more workers to compensate for their freed slaves.
This article draws on the case of Egypt during the First Globalization Era, from its trade liberalization in 1842 until WWI. According to population census data digitized by Mohamed Saleh, while the majority of Egypt’s rural labor force in 1848 were self-employed peasants (51 percent) and wage agricultural laborers (10 percent), 8 percent were subject to coercion.Footnote2 First, under the medieval slavery institution, foreign black slaves (1 percent in 1848), captured in the Nilotic Sudan and imported to Egypt, were sold competitively to all landholders, even though their use in agriculture had been exceedingly rare (Cuno Reference Cuno2009). Second, the Ottoman-Egyptian political elite—owners of large estates—could exclusively use state violence to coerce local workers (7 percent in 1848).
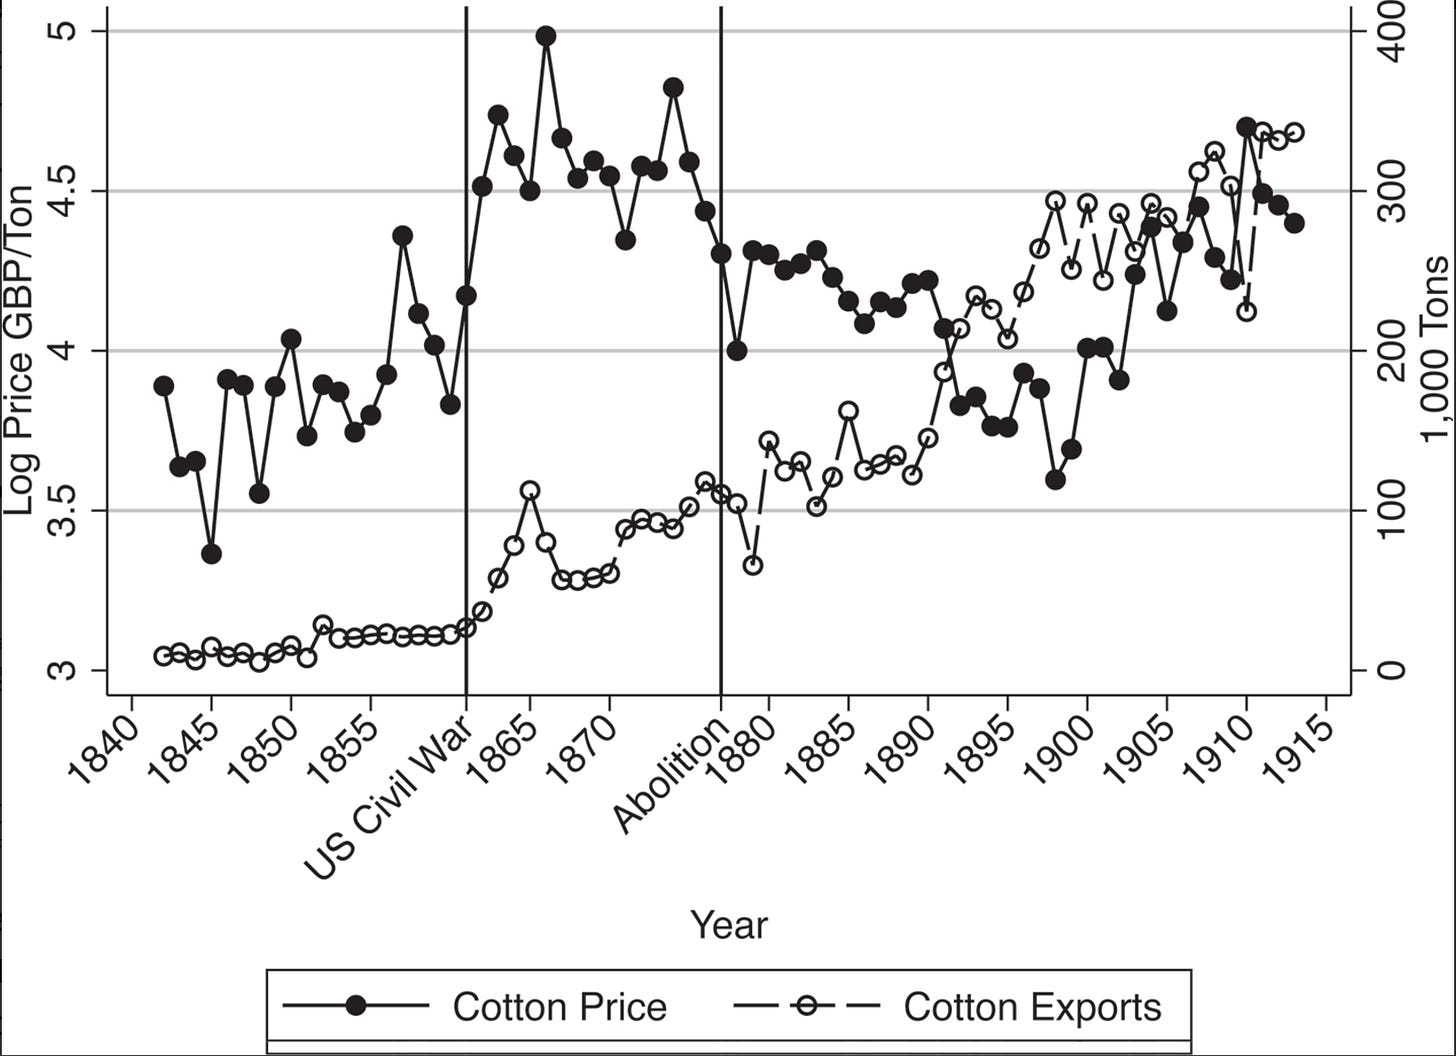
To investigate the effects of trade booms on labor coercion under Egypt’s dual-coercive system, I focus on two key events. The first event is the cotton boom during the U.S. Civil War in 1861–1865. Egypt, a global producer of high-quality long-staple cotton, quadrupled its cotton production and exports by 1865 (Figure 1). Unlike the United States, Egypt did not have international market power on the eve of the cotton boom, and hence, cotton prices were largely exogenous. …
. … Slavery was rare in rural Egypt in 1848, with 0.05 slave per household, on average. Almost all slaves resided in households headed by freemen; only 1 percent of these households owned any slaves, and slave owners had 4.5 slaves on average. However, as predicted in H1(a), the cotton boom caused rural slavery to rise. … the boom had a positive and statistically significant effect on the number of slaves per household … Districts at the third quartile of cotton yield per unit of land in 1877 (Q 3 = 1.5) (henceforth, high-cotton districts) witnessed a greater rise in the number of slaves per household in 1848–1868 by 0.19 slave, relative to districts at the first quartile (Q 1 = 0) (henceforth, low-cotton districts), which is about four times the 1848 average. Column (4) further shows that the proportion of slave owners among free-headed households in high-cotton districts increased by 7 percentage points, relative to low-cotton districts, which is seven times the proportion in 1848. … slave owners in high-cotton districts increased their slaveholdings by 2.7 slaves, on average. … the cotton boom caused an increase in Egypt’s slave imports … The cotton boom in 1861–1865 caused a surge in slavery that was driven by the rising demand for slaves among rural middle-class landholders, not the elite. It also increased state coercion in large estates and reduced wage employment. Furthermore, among cotton districts, rural middle-class landholders in districts with higher levels of state coercion in 1848 purchased more slaves during the cotton boom, relative to their counterparts in cotton districts with lower levels of state coercion, suggesting that state coercion reinforced slavery during the cotton boom
Source: Cambridge
FOOLING WITH YOUR HAIR, 1985. OIL ON CANVAS. 88-1/2 X 180-1/4 INCHES. IMAGE COURTESY OF DAVID SALLE. Source: Meer
If you have scrolled this far, you know you want to click:


