In Europe this week, everyone is talking about a major report on competitiveness published under the leadership of Mario Draghi the legendary former ECB President and Prime Minister of Italy. The reports - Part A with the general argument and Part B with the more technical sectoral arguments - are fascinating and dense reading. In this newsletter I am excerpting some of the more striking graphs, focusing only on the questions of investment and R&D and specifically in comparison with the USA. There is much more to say about China and the many sectoral analyses in Part B.
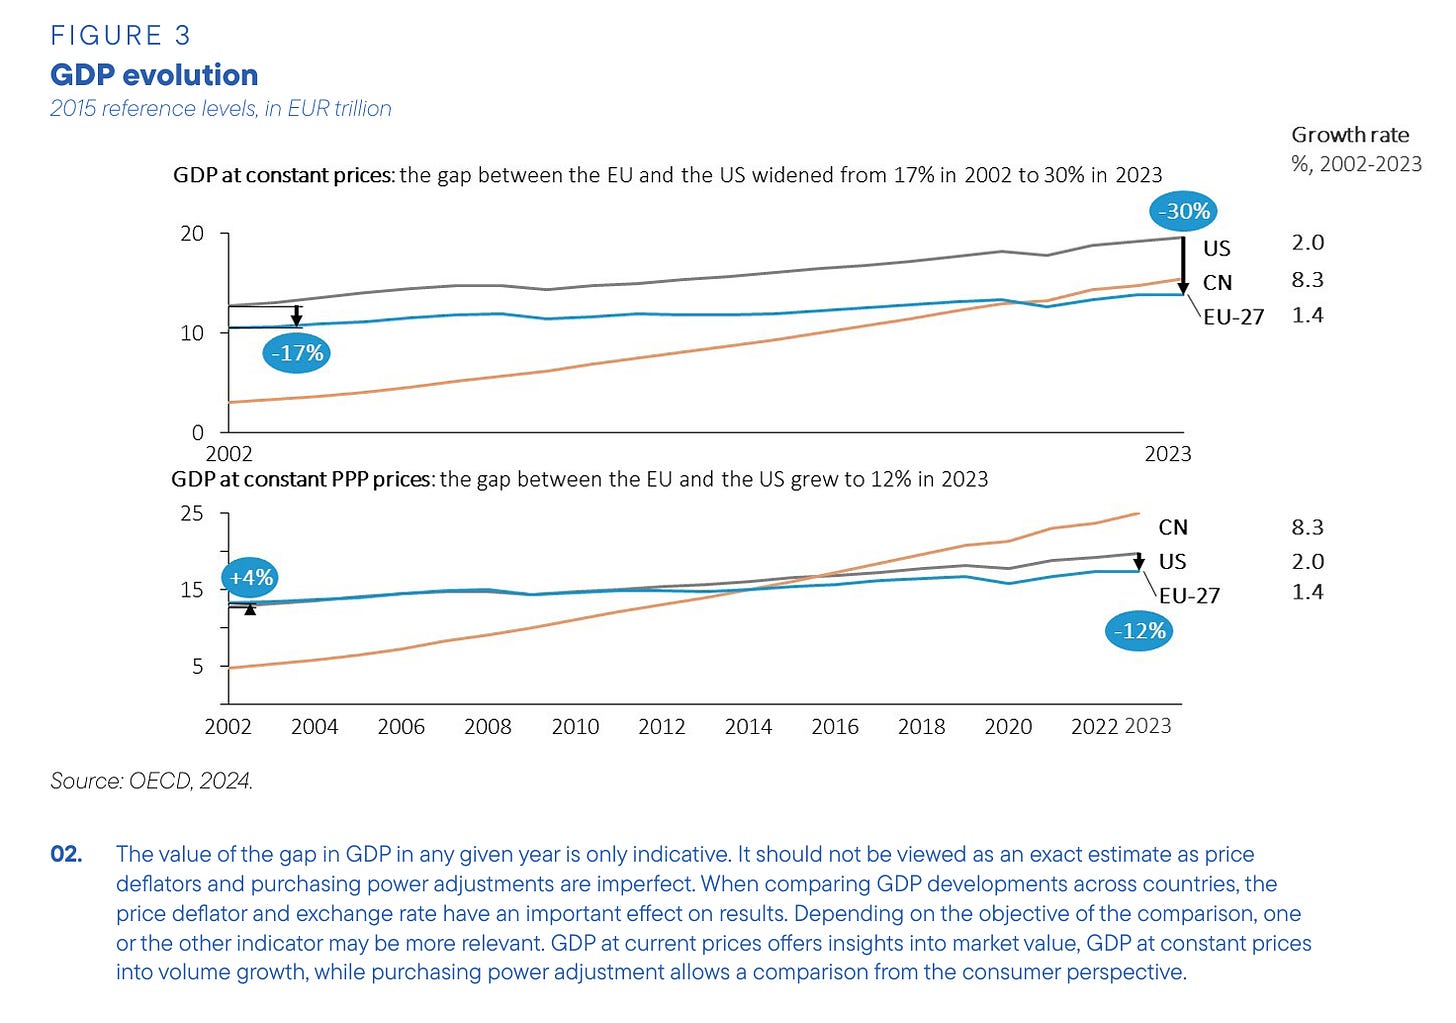
The problem that the report addresses is that: “… EU economic growth has been persistently slower than in the US over the past two decades, while China has been rapidly catching up. The EU-US gap in the level of GDP at 2015 prices has gradually widened from slightly more than 15% in 2002 to 30% in 2023, while on a purchasing power parity (PPP) basis a gap of 12% has emerged. The gap has widened less on per capita basis as the US has seen faster population growth, but it is still significant: in PPP terms, it has risen from 31% in 2002 to 34% today.”
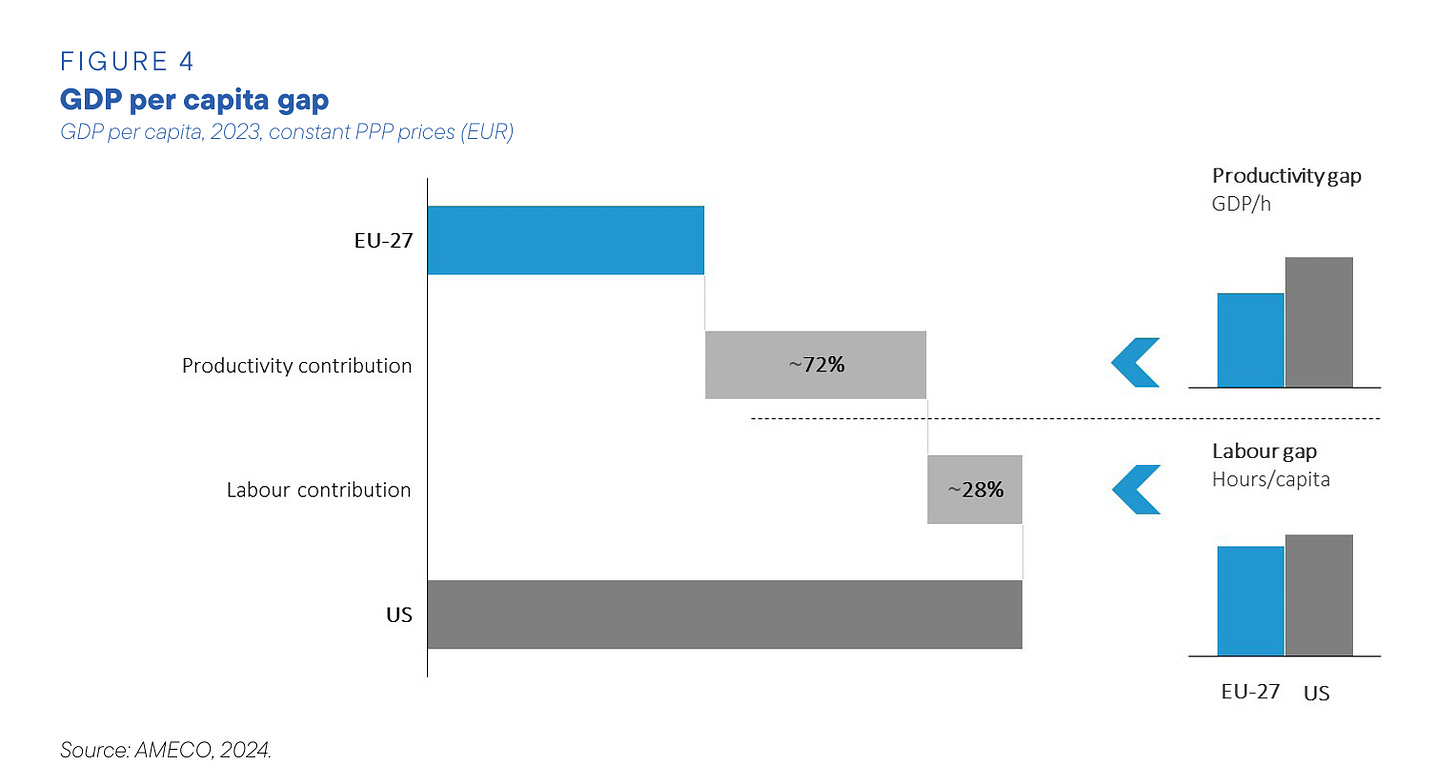
Overall production depends on many variables including overall size of workforce and the amount of hours people work. Europe has slower population growth and Europeans work fewer hours than Americans, but what worries Draghi and his team is the fact that “around 70% of the gap in per capita GDP with US at PPP is explained by lower productivity in the EU. Slower productivity growth has in turn been associated with slower income growth and weaker domestic demand in Europe: on a per capita basis, real disposable income has grown almost twice as much in the US as in the EU since 2000.”
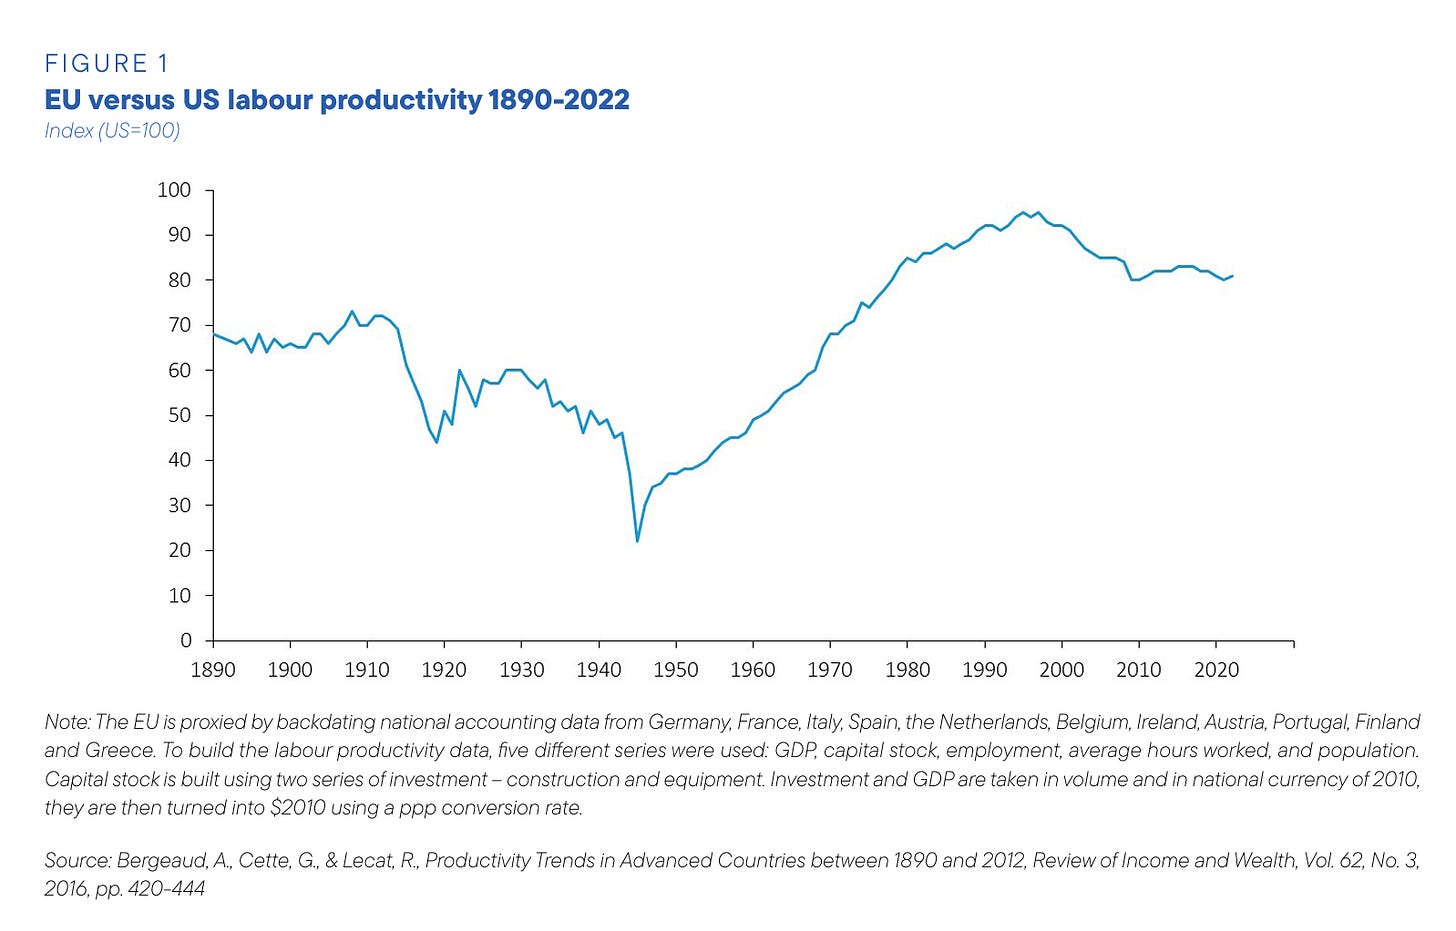
The gap between European and US labour productivity is not a new phenomenon. The gulf was already clear by the late 19th century. It widened to a maximum in the 1940s. Europe’s remarkable growth after 1945 closed the gap to as little as 90 percent in 2000. The worrying thing is that between 2000 and 2010 the gap widened again to 20 percent and since then there has been no re-convergence.
From a quick reading of the reports, I am not convinced that Draghi really addresses the historical question of the timing of this pattern: i.e. convergence 1945-2000, divergence 2000-2010 and parallel development since 2010. What happened in the 2000s and how is Europe now level-pegging? But, setting these ticklish questions aside, the Draghi reports do offer a lot of material with which to explain the fact that European productivity is lower and is not re-converging with the US.
When we seek to explain labour productivity, one obvious place to look is investment. Workers equipped with more capital tend to be more productive.
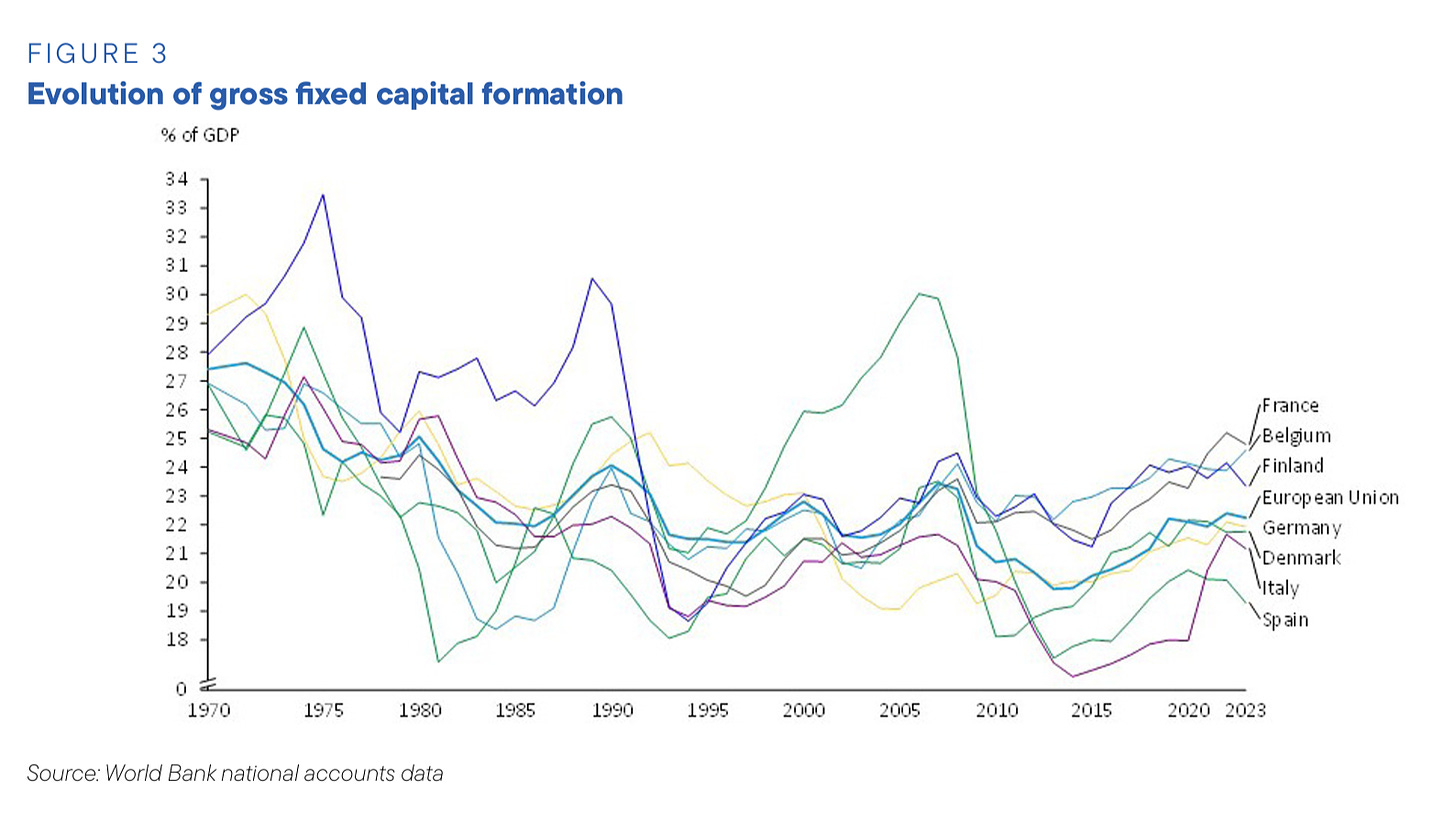
The Draghi report delivers striking data on how investment as a share of GDP in Europe has declined over the last half century.
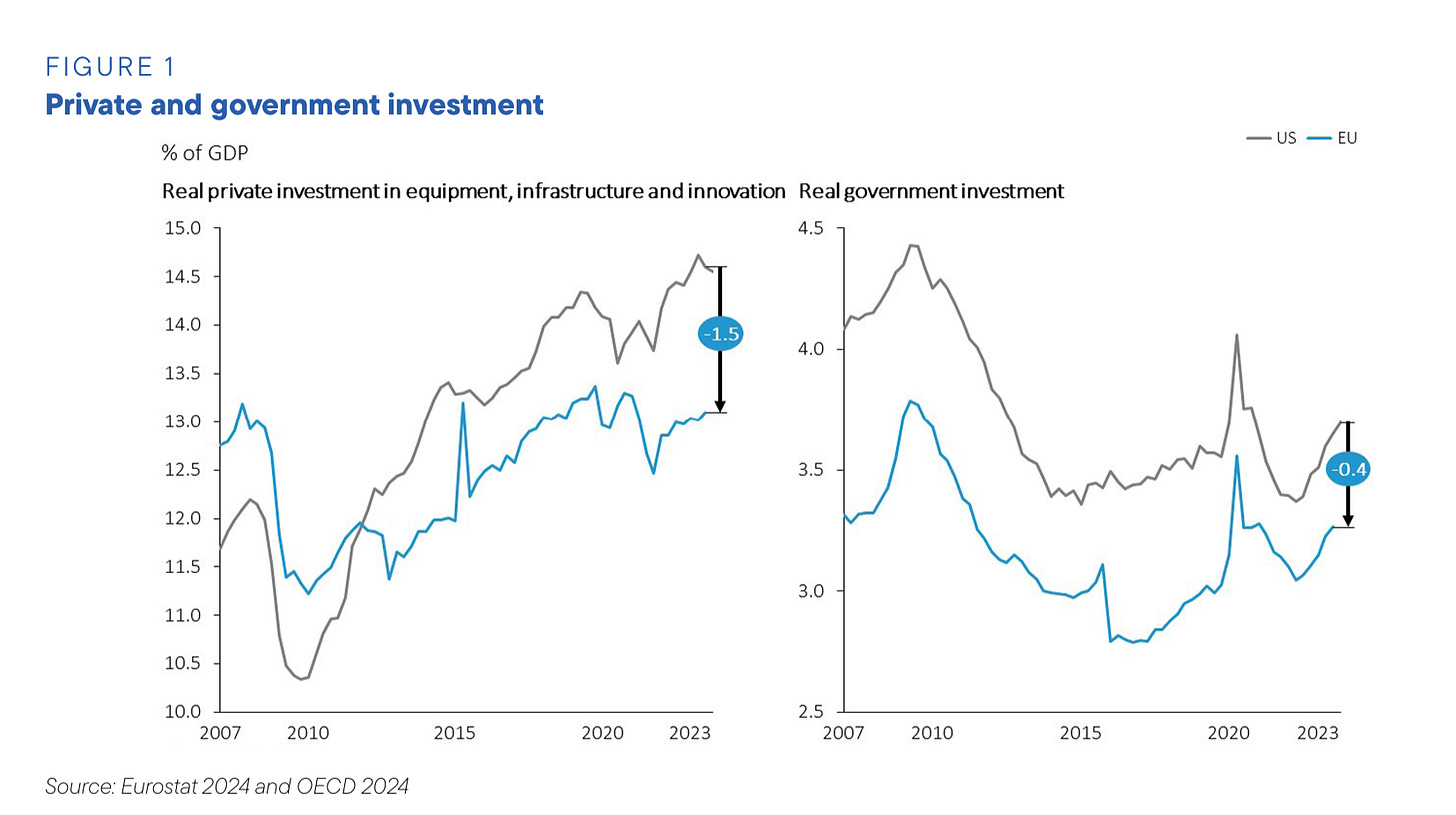
Not only has European investment declined as a share of gdp, it also lags behind investment in the USA. Somewhat counter-intuitively, if you assume that the US has “small government”, public investment in Europe lags chronically behind that in the US. Tbh, I would love to understand that difference better.
It is also counter-intuitive that in the 2000s, as US labour productivity was surging ahead of that of Europe, private investment in equipment, infrastructure and innovation in the US lagged behind that of the EU. After 2010 the balance flipped. As the European economies relapsed into the eurozone recession, US private investment surged ahead and has remained ahead of the EU ever since, to the tune of 1.5 percent of gdp.
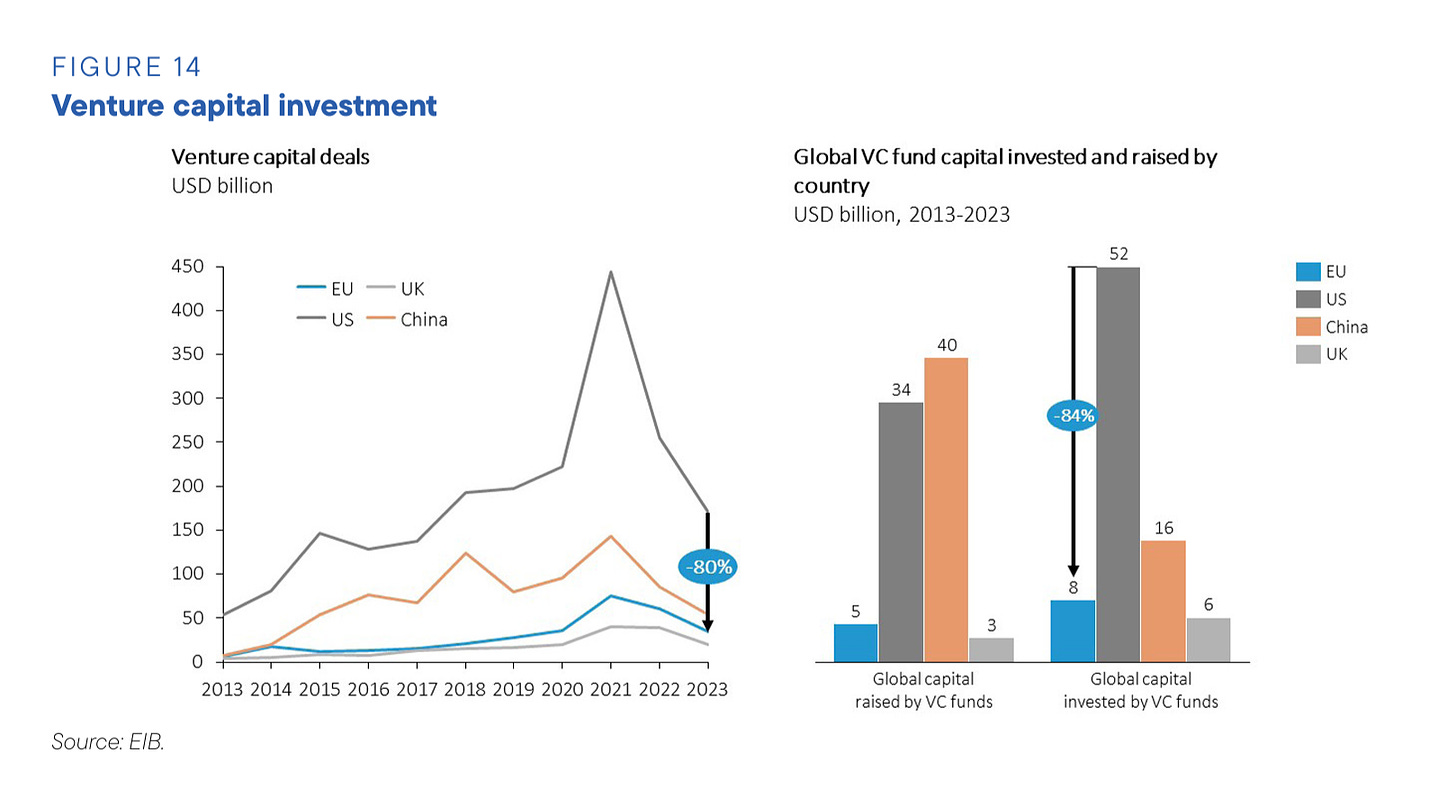
That gap is significant, but perhaps not enough to explain the persistent difference in productivity that we see. Where the US is truly in a different league from the EU is in the most innovative types of investment, notably venture capital.
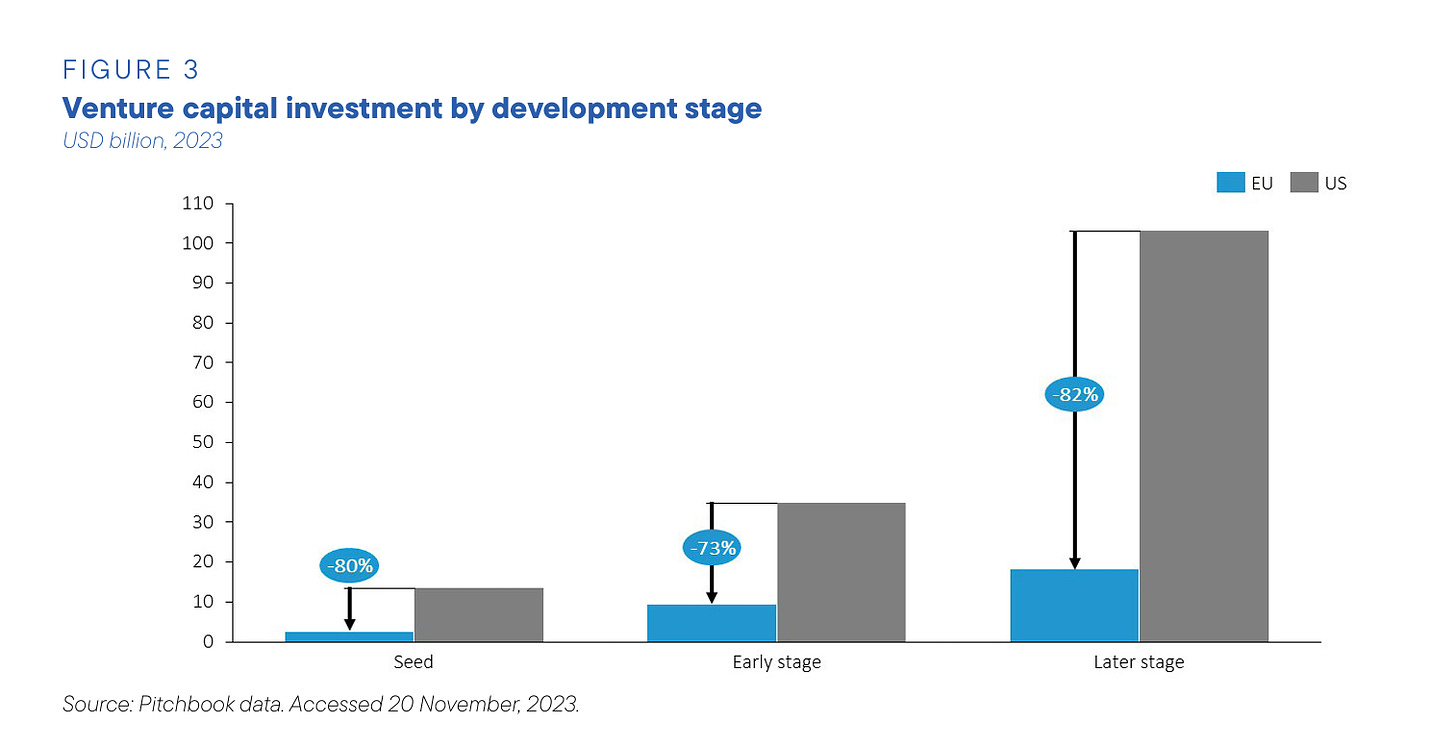
Broadly speaking, on every metric and at every stage of venture capital the ratio between the US and Europe is 4:1.
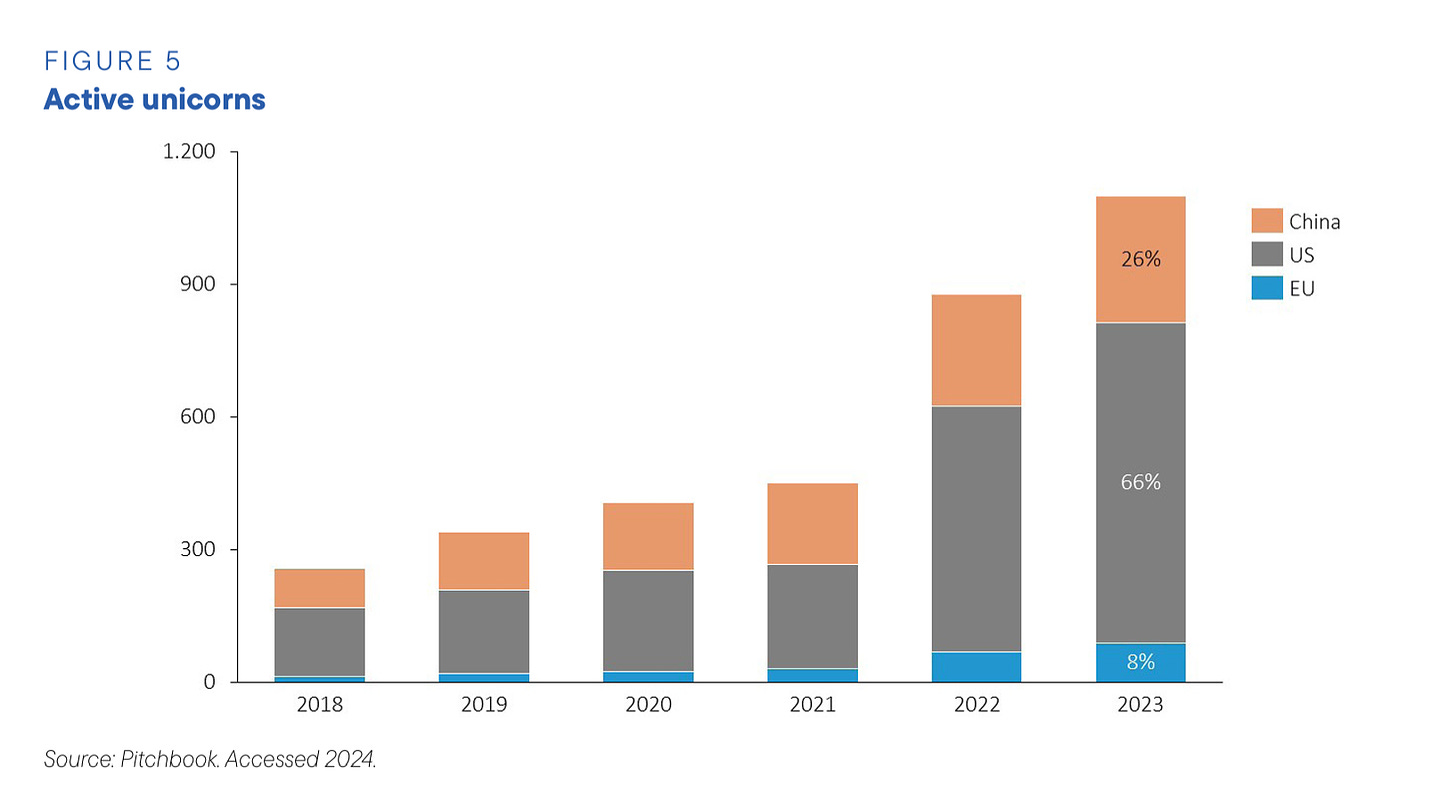
That, in turn, makes it easier to understand the huge advantage of the United States when it comes to unicorns, new billion dollar-plus businesses. Europe’s share of those companies globally is as small as 8 percent, compared to 66 percent for the US.
This is very striking and clearly paints a bleak picture for the EU. It would seem to suggest that we should expect further EU-US divergence in years to come, further deteriorating the status quo that has stabilized since 2010.
Can the EU avoid a dark future of further divergence? Given the ferocity of competition between the US and China and the issues highlighted in the sectoral reports, nothing can be promised for certain. But the Draghi report highlights some obvious avenues through which Europe could seek to counter the pressures making for further divergence.
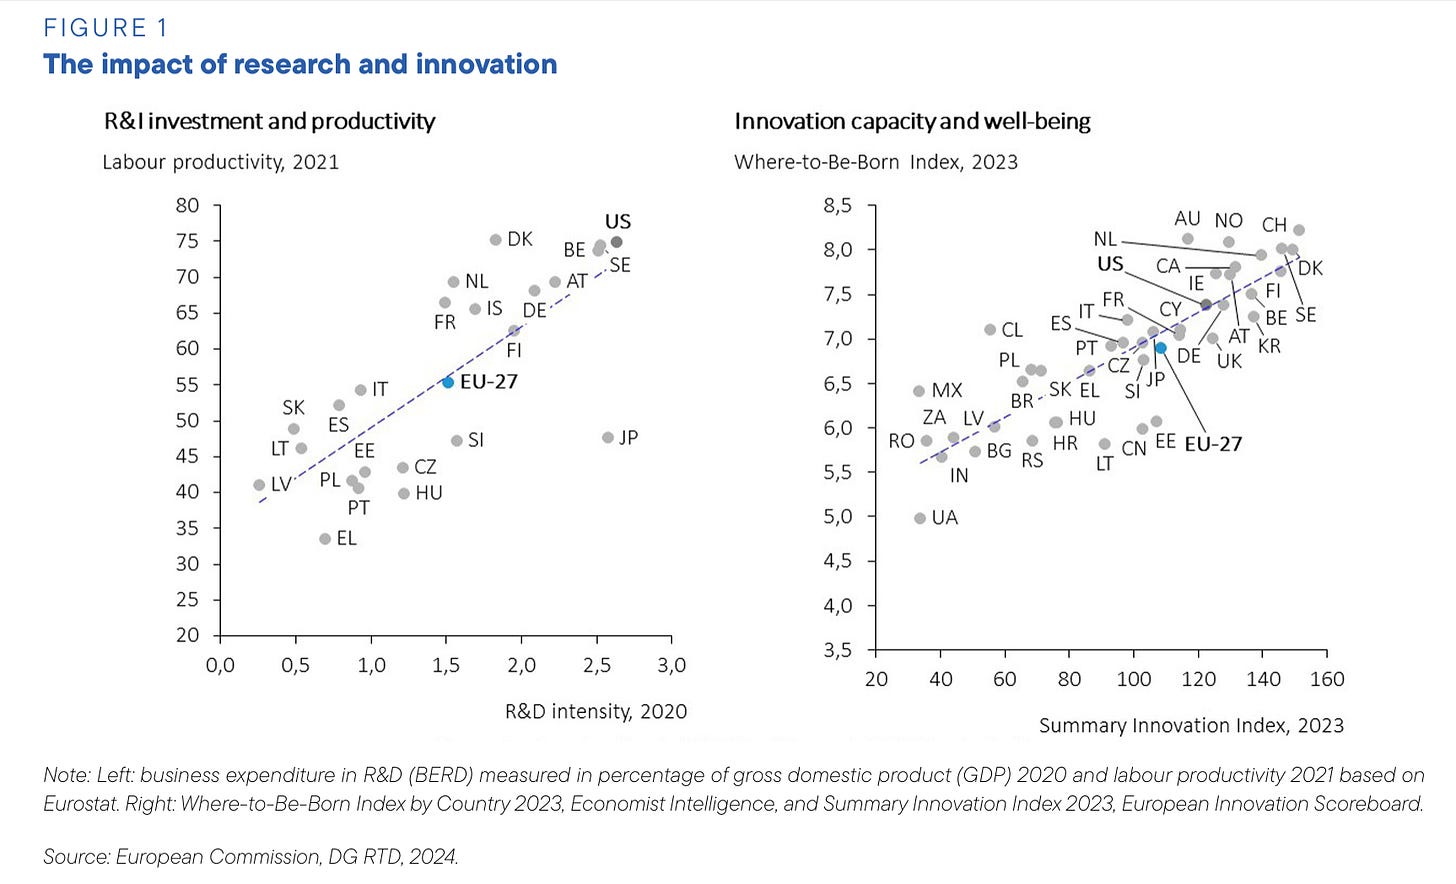
As the Draghi report highlights, there is a strong and clear correlation between standard of living, innovation, R&D intensity and labour productivity.
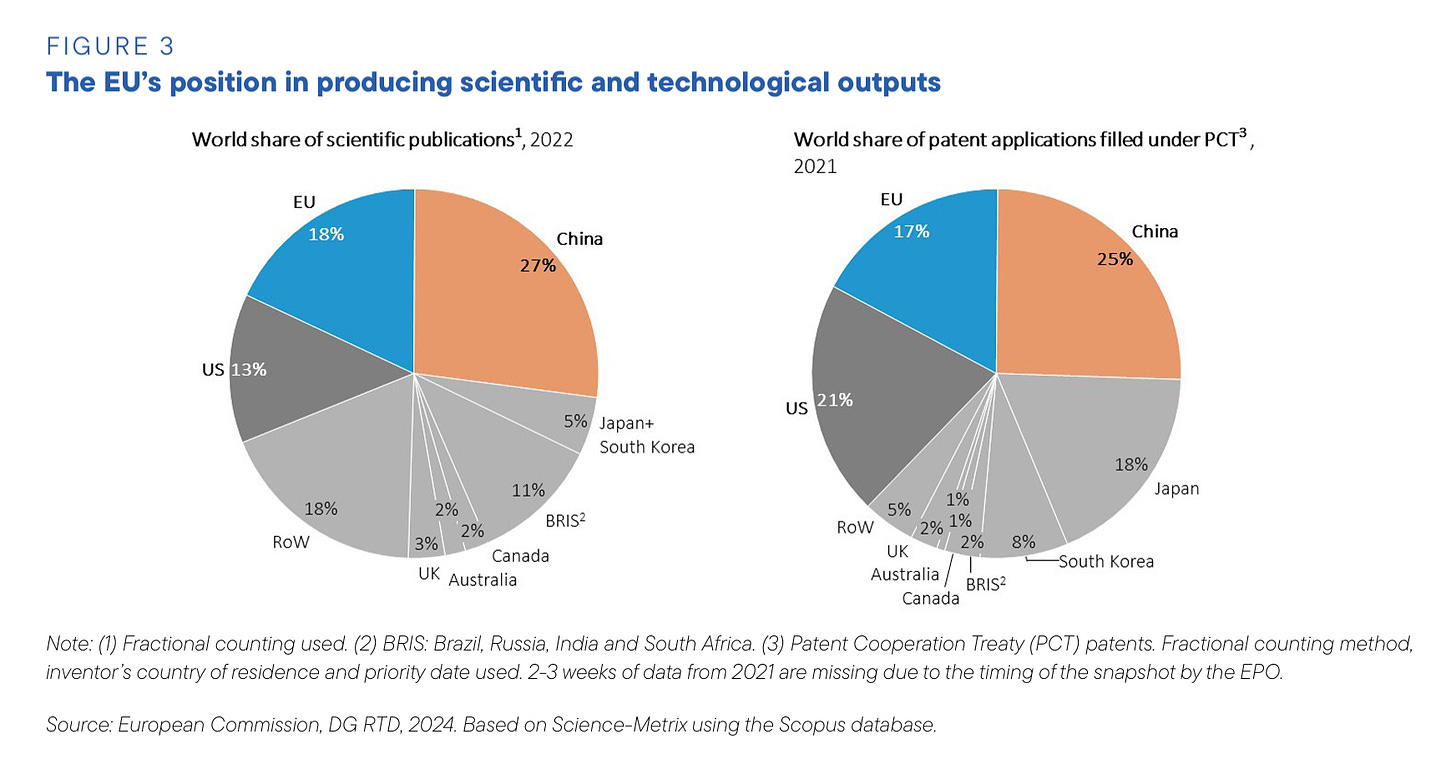
In scientific research and patenting Europe is still an important competitor with the United States and China.
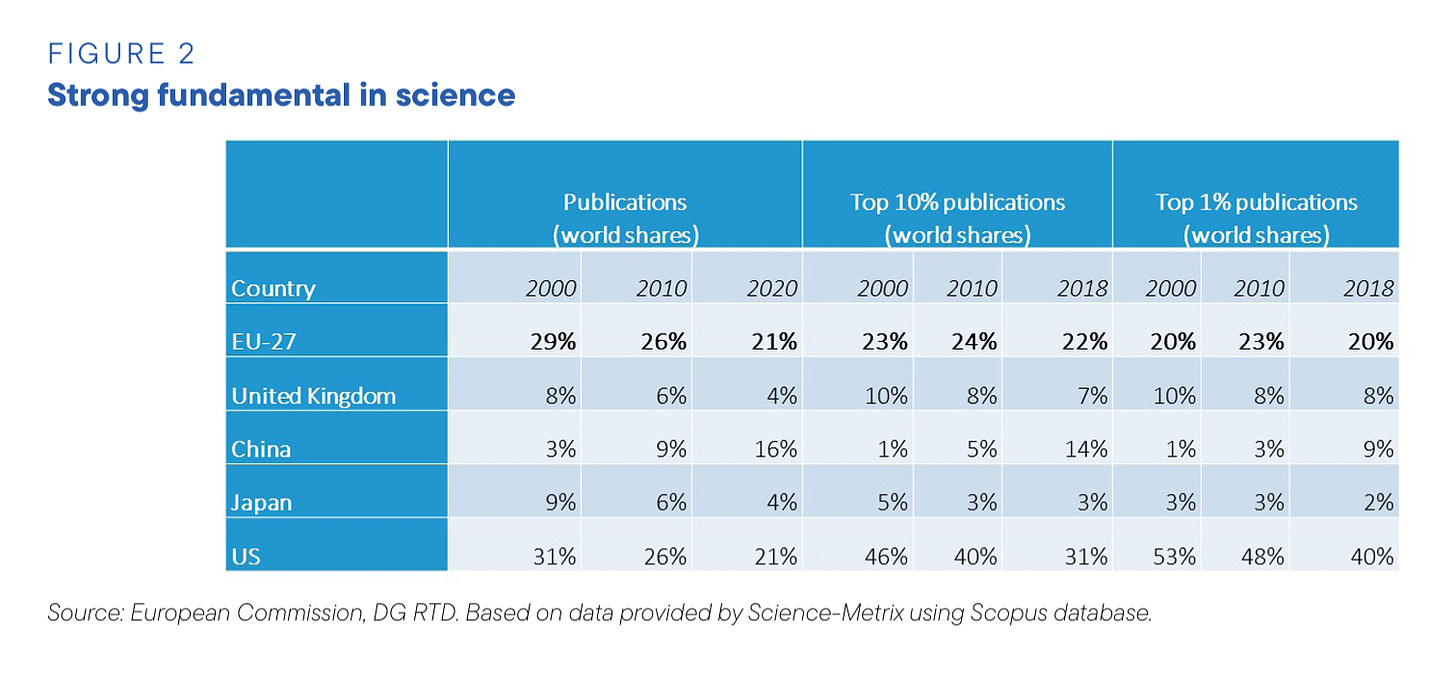
The European position in research is competitive even if we focus on high quality publications. The US position is very strong, but China is still a long way behind.
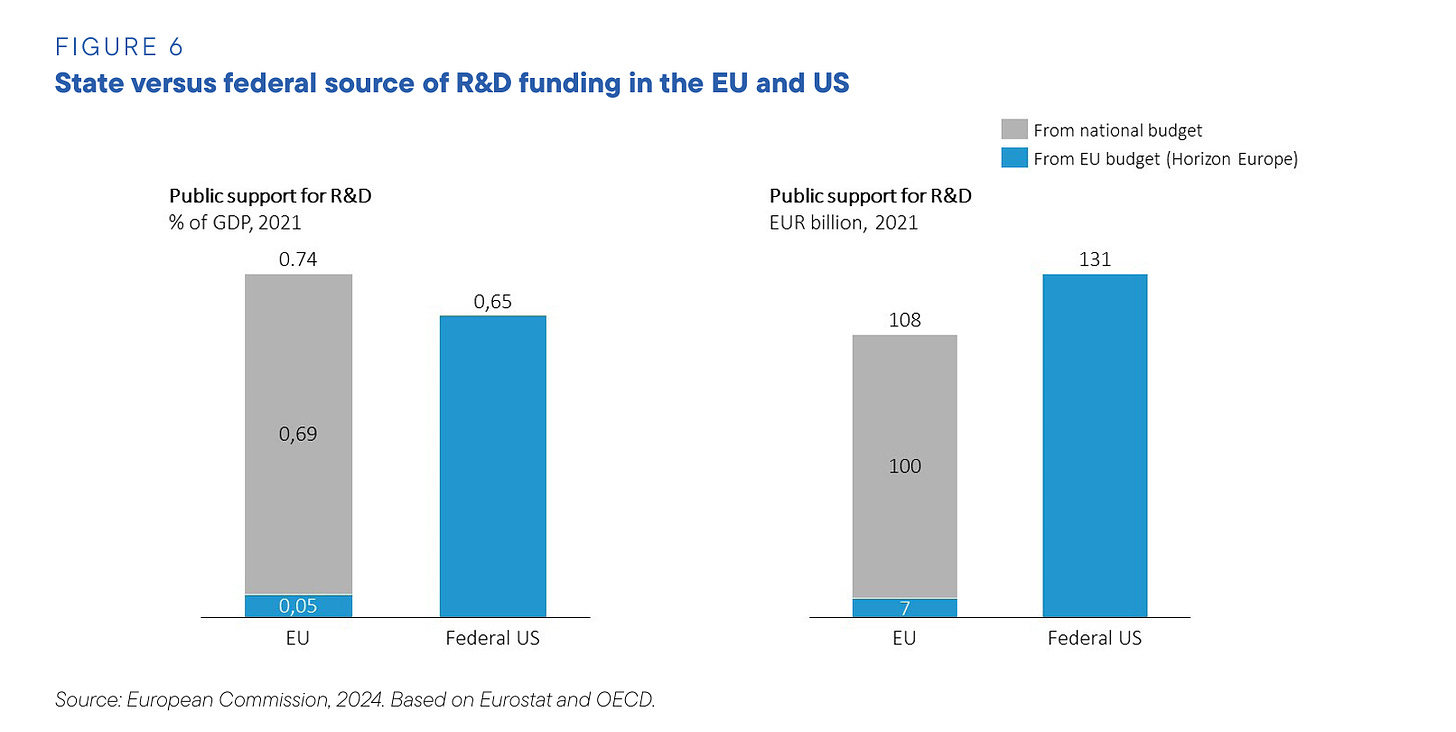
How to translate this into a great leap forward in EU productivity? One point made by the Draghi report is to highlight the fact that EU spending in support of R&D is dispersed rather than concentrated as in the US.
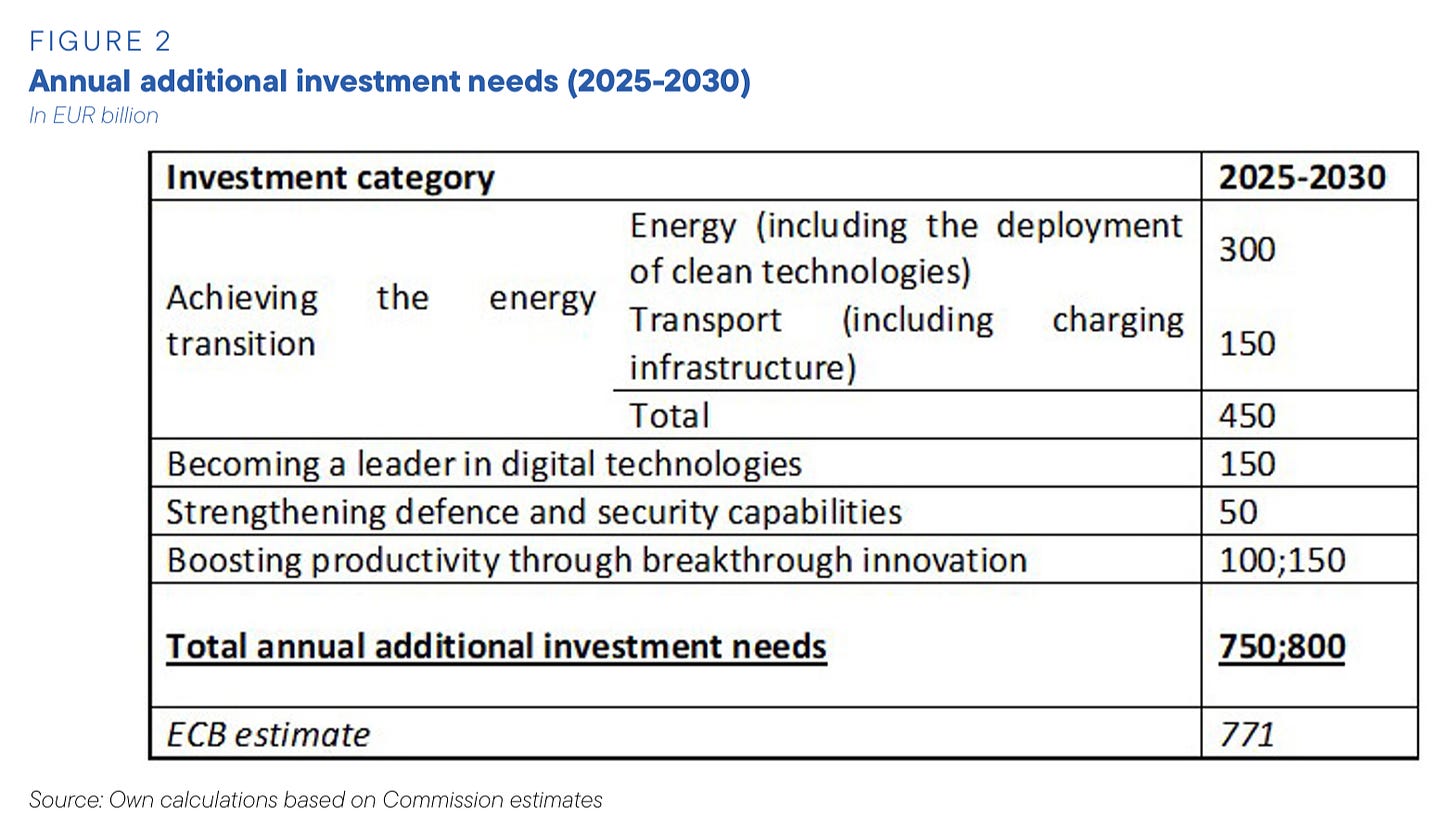
The basic challenge for Europe is to combine its strong position in basic research with a surge in investment. And this is where the Draghi report becomes truly radical. Here is the paragraph that will define the message of the report:
These investment needs are massive and unprecedented from a historical perspective. Investment needs of EUR 750-800 billon (annually) for the EU correspond to 4.4%-4.7% of EU GDP (at the 2023 level). For comparison, investment under the Marshall Plan from 1948 to 1952 amounted to 1%-2% of GDP. Delivering such a massive increase in EU investment would require its GDP share to jump from today’s 22% value to approximately 27%, reversing a multi-decade decline in most large EU economies. Europe has not had similar investment rates since the postwar period, when strong private investment led to a renovated capital base, at a time when government investment and social spending were considerably smaller.
How to achieve that leap forward should be the consuming preoccupation of European politics both in Brussels and at the national level. The opening shots were fired, predictably, by conservatives in Berlin, I won’t call them liberals, denouncing common European borrowing. More on this in newsletters to follow.
I love writing Chartbook. I am delighted that it goes out for free to tens of thousands of readers around the world. What supports this activity are the generous donations of active subscribers. Click the button below to see the standard subscription rates.


