Chartbook 285: Cal-Tex - How Bidenomics is shaping America's multi-speed energy transition. (Carbon notes 14)
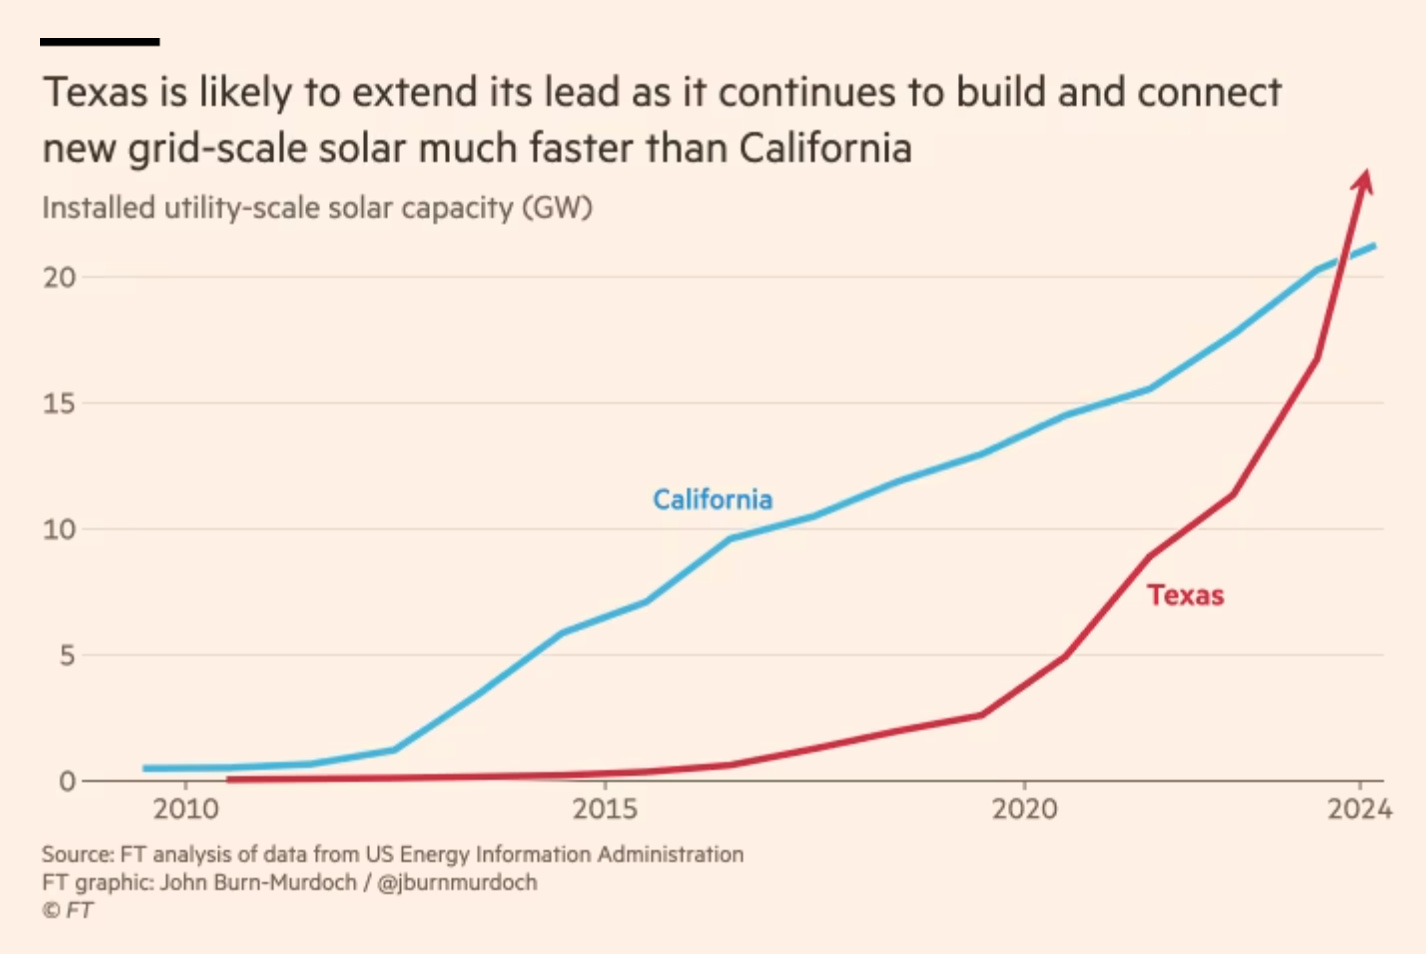
Dramatic things are happening in power generation around the world. As I laid out in Carbon Note 13, in terms of sheer scale, China leads the world in the push for green electricity. But it is not only in China that the world is changing. Even in presumably hostile geographies, renewable power generation is gaining ground, fast. You might think that nowhere was less likely to see a green energy boom than Texas. But, in the last few years, as John Burn-Murdoch pointed out in a recent piece in the FT, utility-scale clean energy generation in Texas has overtaken that in California, America’s champion of all things green. Of course, energy is not “one thing”. Oil can be burned to generate electricity, but you don’t generally run your air conditioner on oil. The wind blows in Texas and the sun shines and Texans know a bargain when they see one. Since 2019 the build out of utility-scale solar in Texas has overtaken the installed capacity in California.
In fairness to California, it still has an overall lead in solar capacity due to its large stock of inefficient, small-scale roof-top installations not captured by this chart.
Is this a “Texas story”, or does it tell us something about the acclaimed policy initiatives of the Biden era - the infrastructure act and the Inflation Reduction Act (IRA)? Is the Texas renewables boom an improbable triumph of the IRA?
The question was prompted by the fact that the Burn-Murdoch report did not mention the IRA. When I raised the issue on twitter he generously elaborated that all of the capacity shown in his Texas data had been in the pipeline before the IRA was enacted and the Biden policy measures never came up during his research.
So this really peaked my interest. If the Texas solar boom, the biggest in the USA, has little to do with Bidenomics, are we exaggerating the impact of Bidenomics? Rather than the shiny new tax incentives is it more general factors such as the plunging cost of PVs driving the renewable surge in the USA. Or, if policy is indeed the key, are state-level measures in Texas making the difference? Or, is this unfair to the IRA? Are its main effects still to come? Will it pile-on a boom that is already underway?
When I posed these questions on twitter they provoked a lively and constructive debate for which I am truly grateful. What did I learn?
First, when we compare the US renewable energy trajectory with the global picture, there is little reason to believe that Bidenomics has, so far, produced an exceptional US trajectory. Everywhere, new investment in green energy generation is being propelled by general concern for the climate, shifting corporate and household demand, the plunging prices for solar and batteries triggered by Chinese policy, and a combination of national and regional interventions. As far as Europe is concerned the hoopla around Biden’s IRA has contributed to the bow-wave of urgency. The global data may themselves reflect the way in which expectations have shifted worldwide under the impact of US policy.
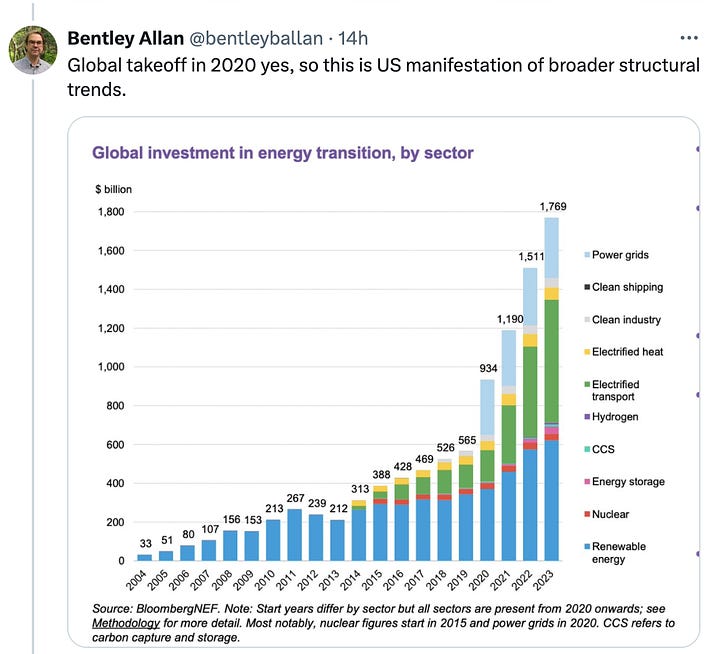
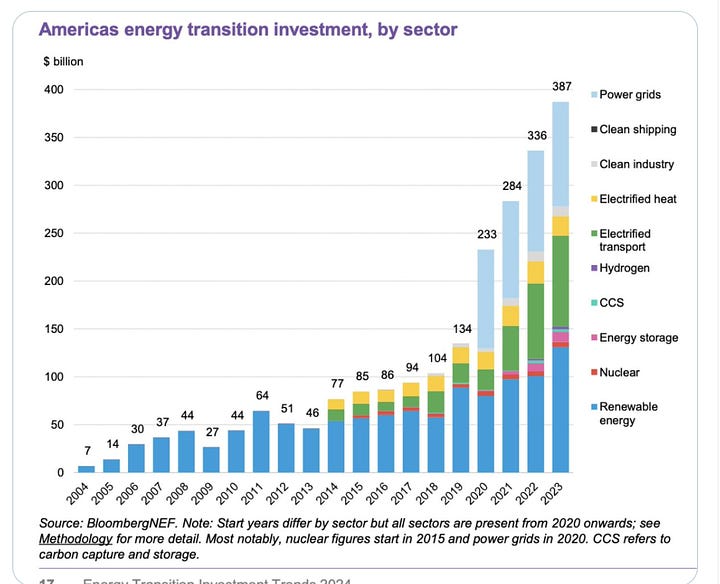
The source for this is Bentley Allan Johns Hopkins
Of course what I am looking for is not just a general comparison of trends but an answer to the nagging counterfactual question: How different would we expect this data to look without the IRA? To get an answer to that question we need models. It is only with their help that we can distinguish the changes attributable to policy interventions as compared to general prevailing conditions and pre-existing trends. The most useful overview of these modeling efforts that I have been able to find is by Bistline et al “Power sector impacts of the Inflation Reduction Act of 2022” in Environmental Research Letters November 2023. If anyone has a better source, please let me know.
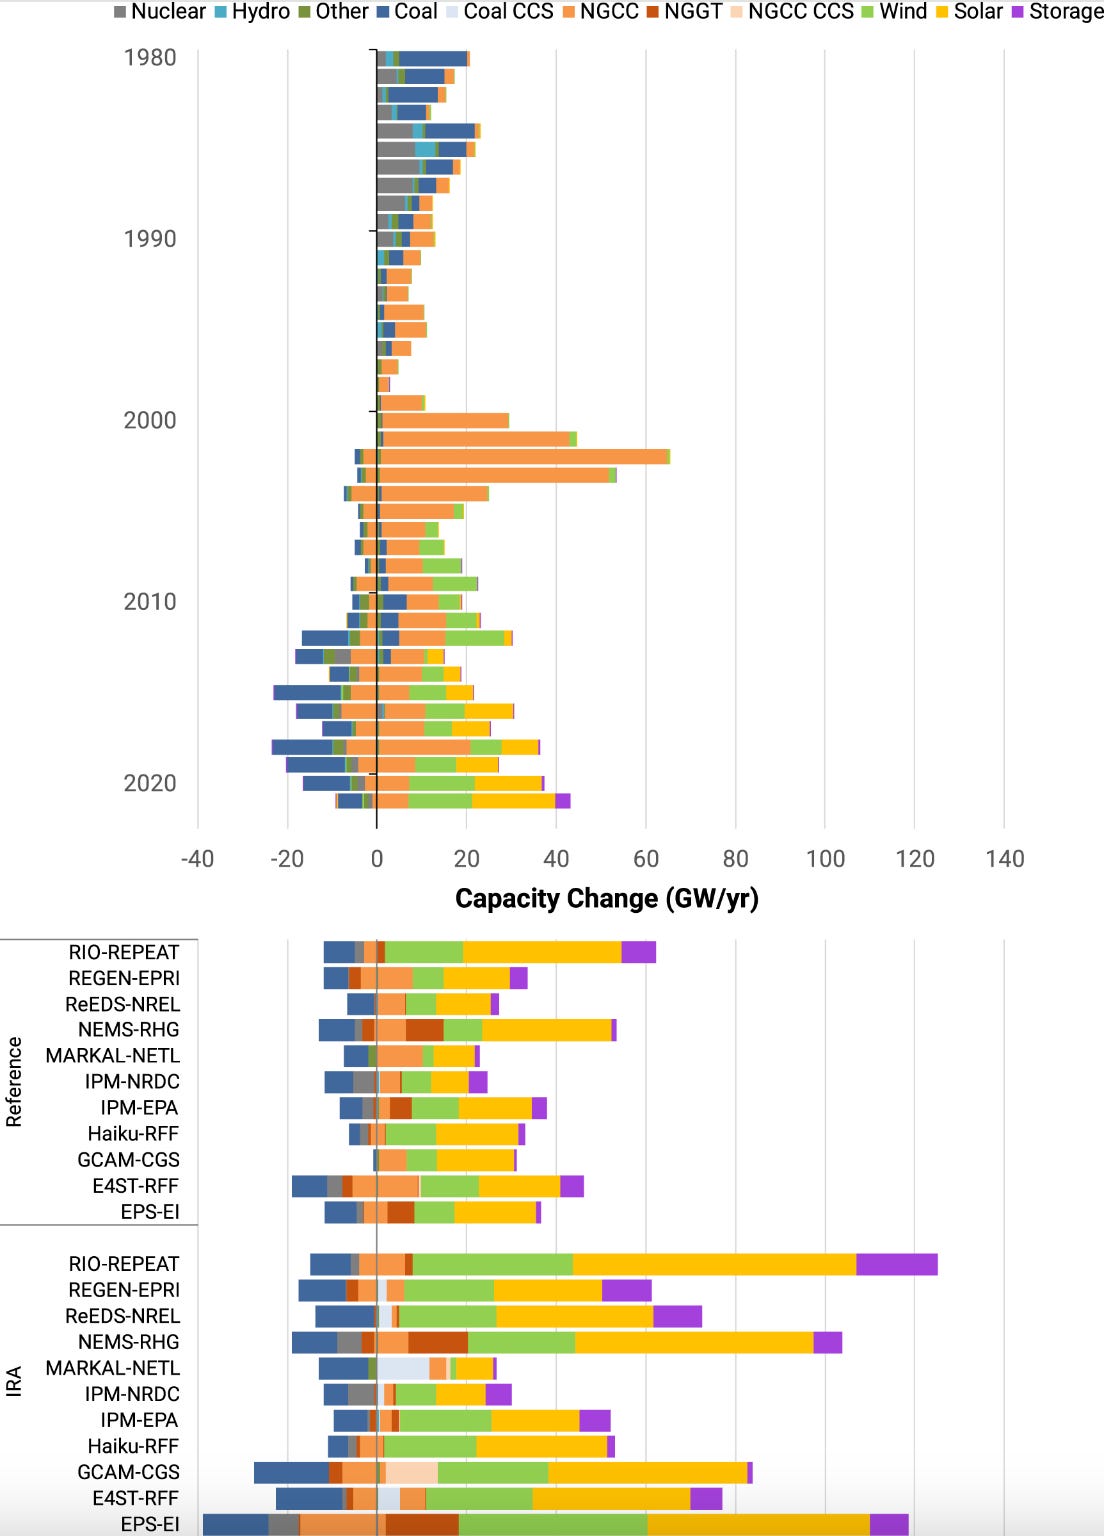
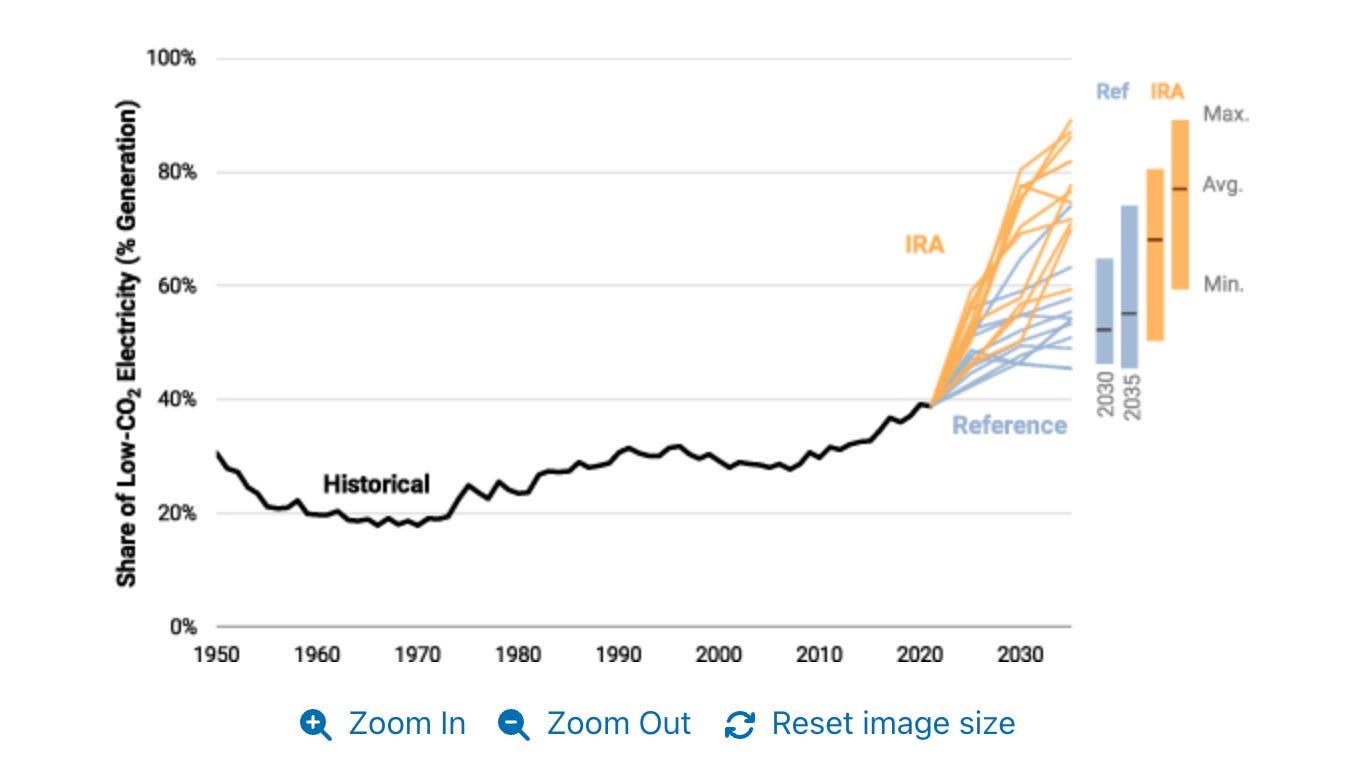
Bistline et al use a suite of models to gauge the possible range of futures for the US electricity generating system with and without the IRA. As a benchmark they use the past trajectory of the US electricity system.
The top panel shows the historical trajectory of US generating capacity from 1980 to 2021. The second half of the graphic shows how 11 different models predict that the US electricity system might be expected to develop up to 2035, with and without IRA.
Clearly, all the models expect the trends of the 2010s to continue through to the 2030s which means that solar, wind and battery storage dominate America’s energy future. Even without the IRA, the low carbon share of electricity generation will likely rise to 50-55% by 2035. Bidenomics bumps that to 70-80 percent.
We can, therefore, rephrase our question about America’s trajectory in the last few years. The question is: “How does the renewable surge of 2022-2024, compare to the model-based expectations, with and without the IRA?”
The answer is either, “so so”, or, more charitably, it is “too early to tell”. In broad terms the current rate of expansion is slightly above the rate the models predict without the provision of additional Bidenomics incentives. But what is also clear is that the current rate of expansion, is far short of the long-run pace that should be expected from the IRA. Several models predict build-outs under IRA at the rate of 60-80 GW pa through to 2035. That is ambitious. But, as the WRI points out in a useful stock take, that is the pace required if the US is to achieve its climate goals.
At this point, defenders of the IRA interject that the IRA has only just come into effect. Cash from the IRA is only beginning to flow. And in an environment of higher costs for renewable energy equipment and higher interest rates, cash matters. So, to judge the impact of the IRA to date, the real question is not what has been built in 2022 and 2023, but what is in the pipeline.
On twitter Julia Coronado and Paul E Williams kindly provided many pointers for how the IRA is impacting solar and renewable energy development in Texas. Crucially, promising to extend renewable energy tax credits over a longer time horizon created more stability for investment and may have triggered a surge of new applications for interconnection. As Yakov Feygin put it: “Maybe the pithiest way to put it is that there are pre-IRA trends and outside IRA trends, but IRA has served to rapidly compress the timeframes for installation in a lot of technologies. So five years has turned into two, for example.”
Advised by JP Morgan, sophisticated global players like Ørsted are optimizing their use of both the production and investment tax credits offered by the IRA to launch large new renewable schemes. Of course, correlation is not the same as causation. Ørsted is in green energy for the long haul. A tax incentive is nice but investment plans are shaped by many factors. If we read the reports closely they highlight the importance of demand for green energy from large corporations, which is largely independent of IRA incentives and driven by global corporate agendas. Where the IRA is perhaps doing its most important work may be in incentivizing the middle bracket of projects where green momentum is less certain.
According to Utility Drive: “The 10 largest U.S. developers plan to build 110,364 MW of new wind and solar projects over the next five years, according to S&P Global Market Intelligence, but the majority of these projects remain in early stages of development. Just 15% of planned wind and solar projects are under construction, and 13% are considered to be in advanced stages of development, … ”
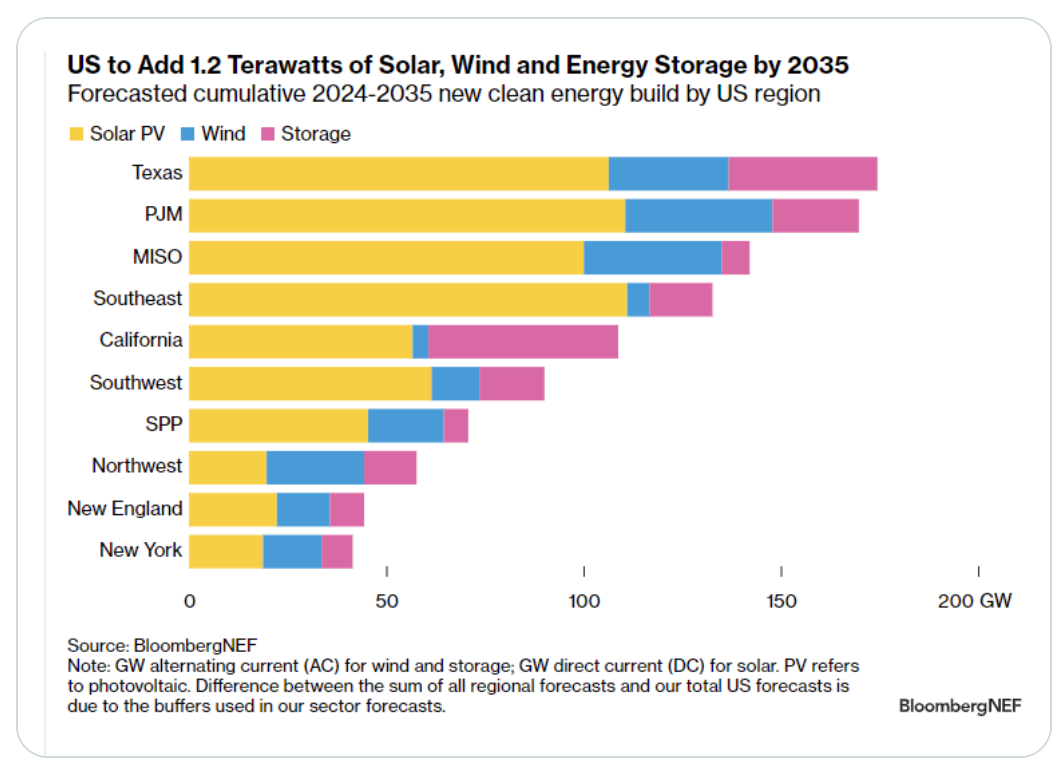
So there is a lot to get excited about, at, what we are learning to call, the “meso”-level of the economy (more on this in a future post). But how does all of this cash out in terms of the capacity pipeline? Special thanks go to Leonardo Buizza who chipped in with these very useful data on the expected build-out in the US by region.
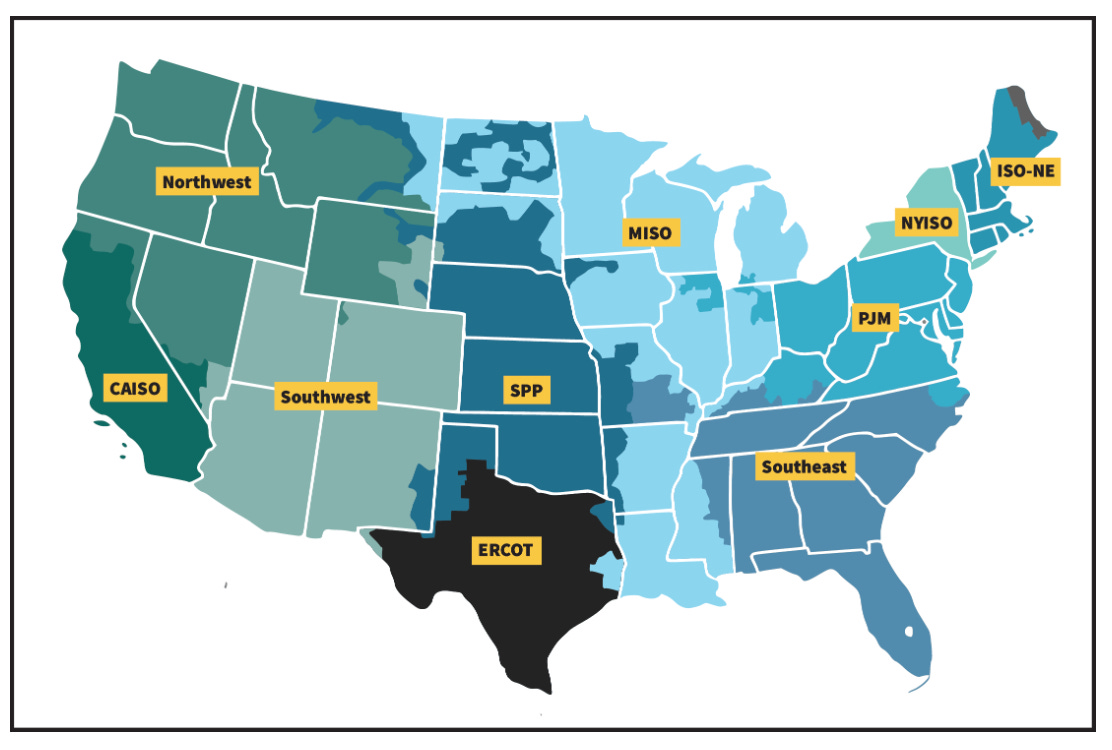
For the uninitiated, the regional designations refer to the patchwork elements of America’s decentralized electricity distribution networks.
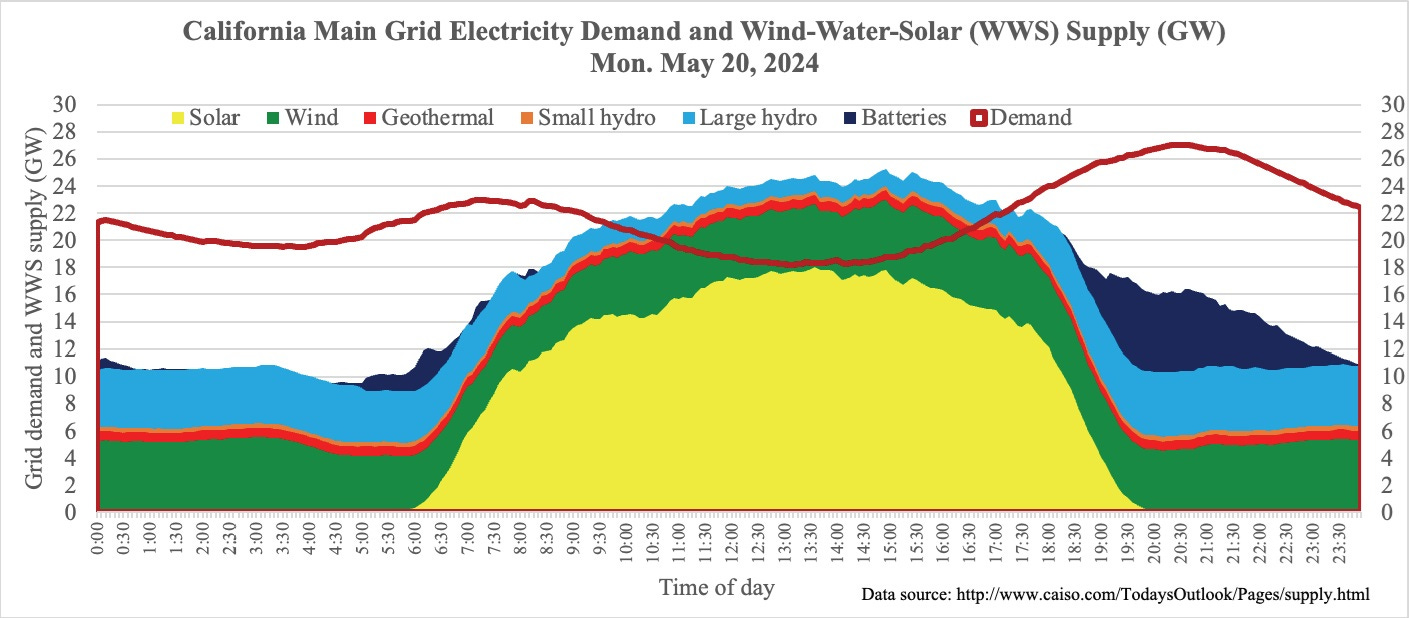
Along with Texas, the pipelines for the PJM, MISO and Southeast regions (which includes Florida) look particularly healthy. The relatively modest California numbers should not be a surprise. As Yakov Feygin and others pointed out, what is needed in California is not more raw generating capacity, but more battery storage. And that is what we are seeing in the data.
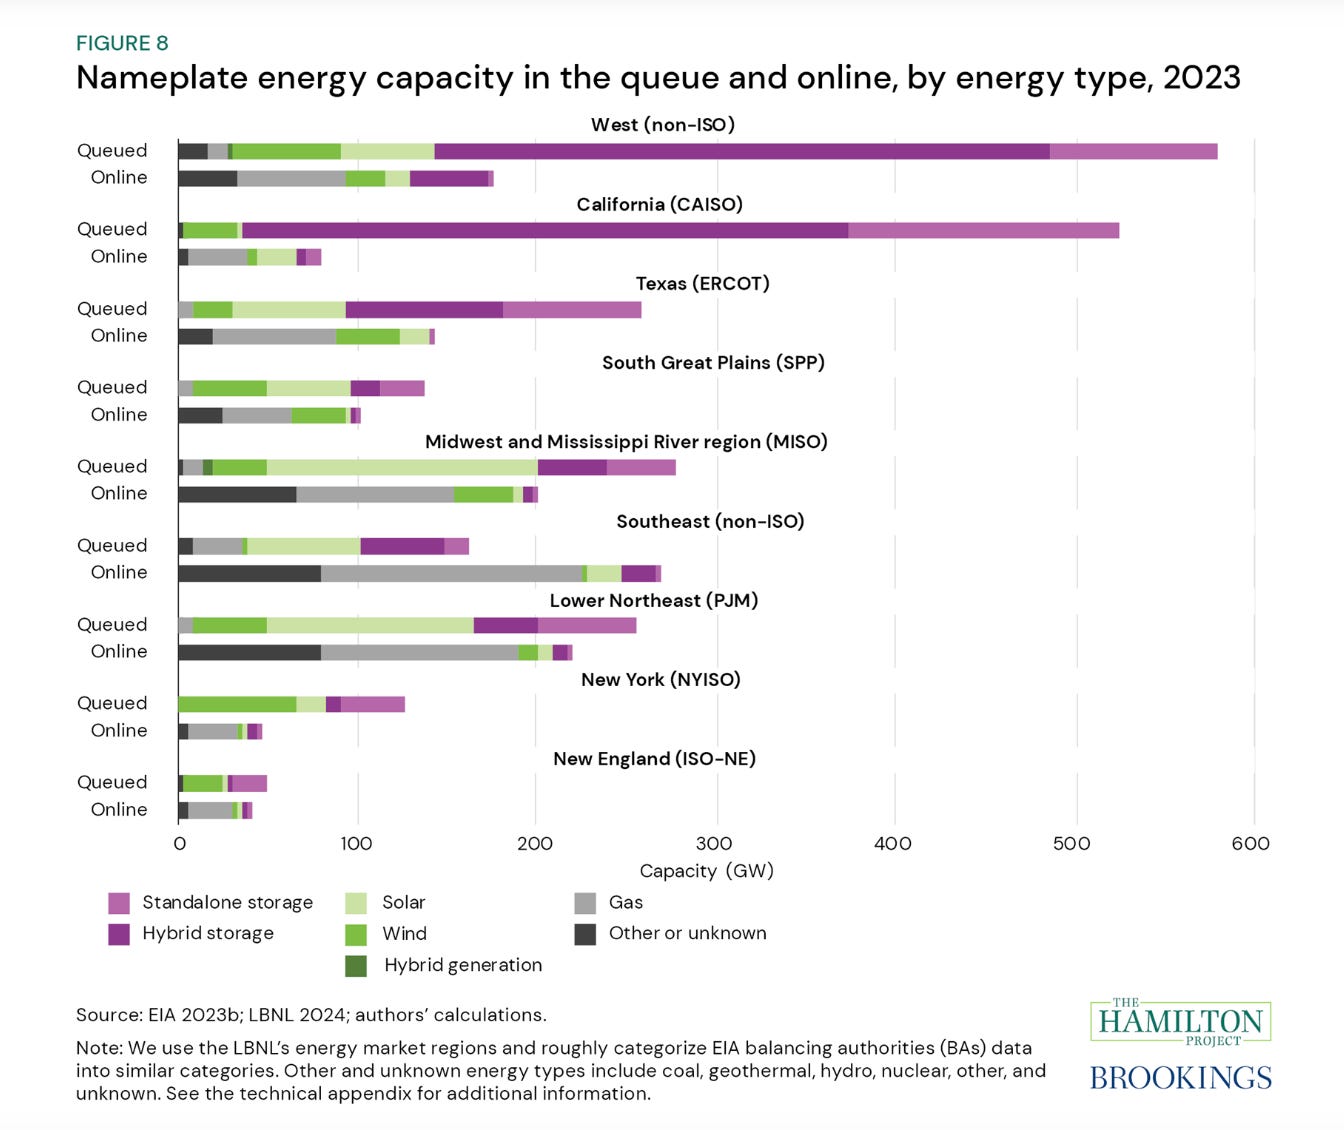
The numbers would be even larger if it were not for the truly surreal logjam in California’s system for authorizing interconnections. According to Hamilton/Brookings data the volume of hybrid solar and batter capacity in the queue for approval is 6.5 times the capacity currently operating in the state. In other words there is an entire energy transition waiting to happen when the overloaded managerial processes of the system catch up. Texas’s less bureaucratic system seems to be one of its key advantages in the extremely rapid roll-out of solar.
Of course, the interconnection issues are real. As electricity networks accommodate more and more renewables, systems management become the key. Storage and interconnection are vital components of large system management, especially now that California is entering the zone where renewables dominate its electricity supply.
Source: PV-magazine
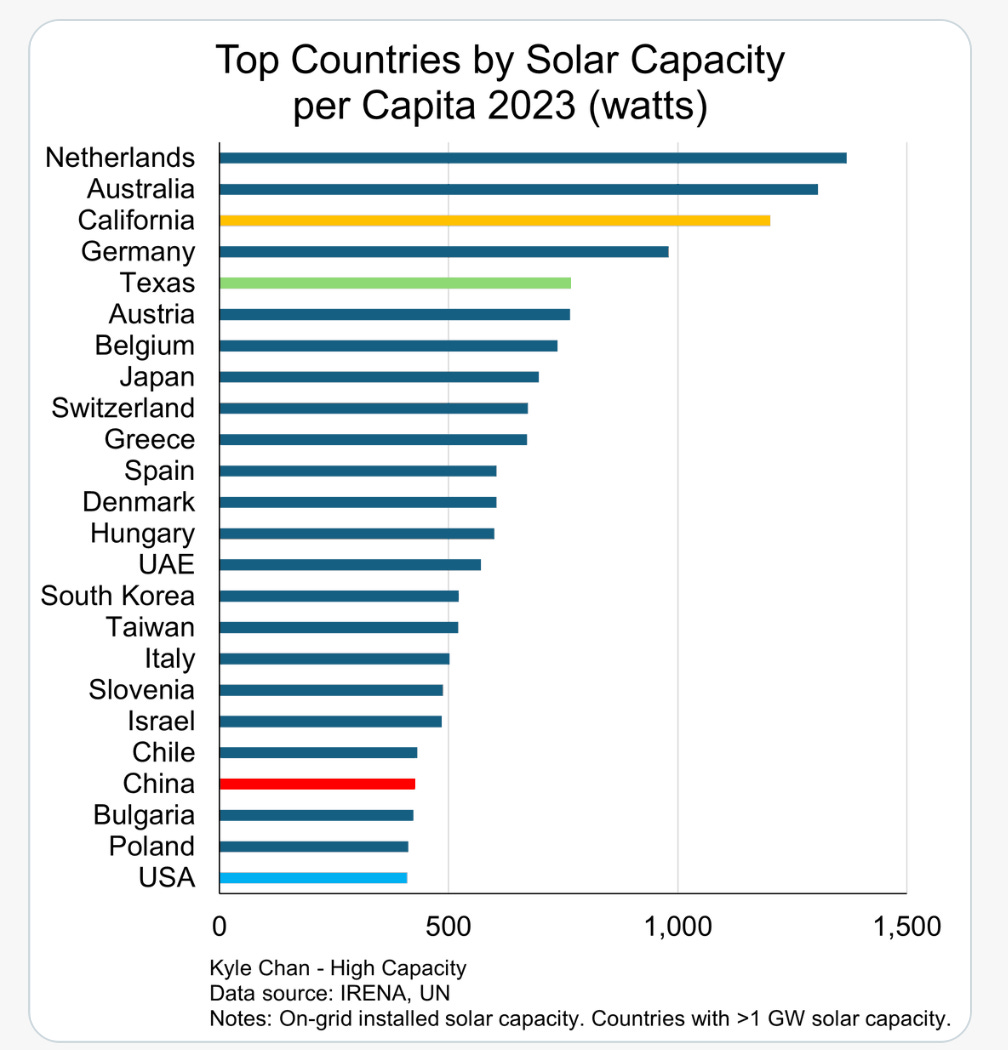
As Kyle Chan helpfully points out, though it may be true that globally speaking the United States as a whole is a laggard in renewable energy development, if we treat the larger American states as the equivalent of European nation states, then the picture looks quite different.
If California (with an economy roughly comparable to that of Germany at current exchange rates) and Texas (with an economy roughly the size of Italy’s) were countries, they would be #3 and #5 in the world in solar capacity per capita.
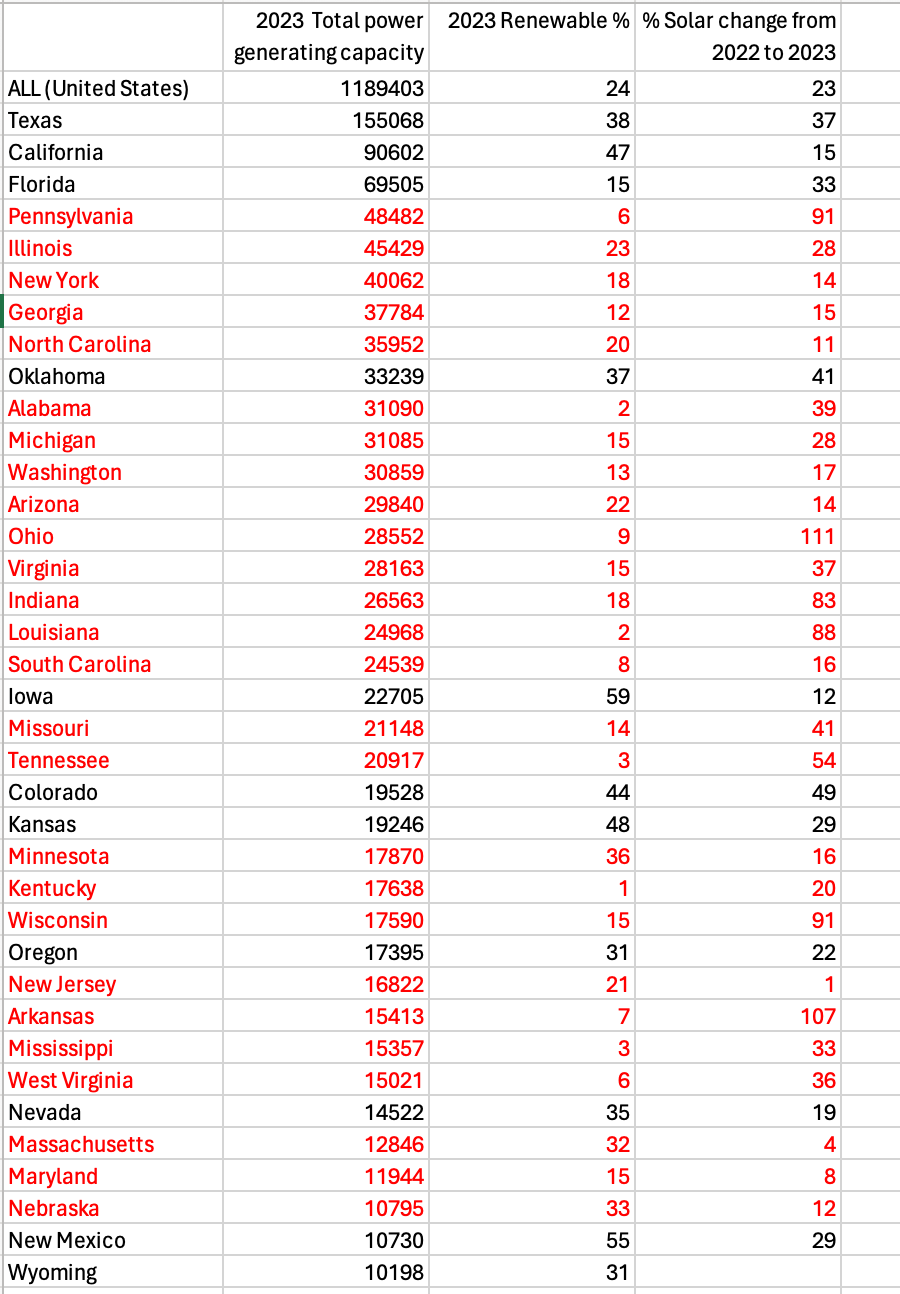
So, with dramatic developments happening across many parts of the United States and the IRA powerfully adding to that momentum, the obvious question is, which are the laggards in the US energy system. To get a general overview I used data from Climate Central to rank US states by their importance in terms of overall electricity production (capacity), their current position in the energy transition (proxied by the share of wind and solar in total state-level generating capacity) and their momentum as measured by the growth of solar in 2022-2023. The states that I have highlighted in red stand out either for their unusually low existing level of renewable power capacity or their lack of current momentum. To give one important example, Florida avoids the red mark because of the considerable push in solar.
What the state-level data reveal is that there are a significant number of large states in the USA where solar and wind energy have barely made any impact. Pennsylvania, for instance, gets the red marker because of the extraordinarily low level of both wind and solar power. Admittedly, these data do not capture other forms of renewable and low carbon energy, like hydro and nuclear power. But, given the cost curves over the last decade, that is not a good reason for not have been building out solar.
What is also striking, is the slow momentum of solar build-out since the boom began in 2020 in many prominent “blue states”. New York - the birth place of the Green New Deal - is a notable laggard in the pace of solar build-out. New Jersey - the “garden state” - has seen virtually no solar expansion in 2022-2023. Massachusetts is barely any better.
The relative levels of sunshine between US states is irrelevant. As the global solar atlas shows, the entire United States has far better solar potential than North West Europe. If you can grow corn and tobbaco, you can do utility-scale solar. The fact that Arizona is not a solar giant is mind boggling.
So what is the upshot?
About 40 percent of America’s electricity system is either already heavily driven by solar and wind or is seeing considerable momentum in the solar build-out. Not much of this is immediately related to the IRA, but there is more in the pipeline. But taking this dynamic segment where the energy transition is under way as representative, results in a skewed picture. Texas is both big and truly remarkable. California already is a world leader in renewable energy. Meanwhile, the majority of the US electricity system presents a very different picture. There is a huge distance to be traveled and the pace of solar build-out is unremarkable.
This is where national level incentives like the IRA must prove themselves. Of course, to make a national-regional distinction is unhelpful. What I am arguing for here is an approach that applies the logic of combined and uneven development at the sub-national level. In every single case the argument has to be won on the ground locally, but if Federal incentives can shift the terms of the argument they can unleash huge potential for catch-up investment. Some of that is already in the pipeline. But New York and New England, SPP are laggards in the pipeline data too. That there is not more solar development queued up for the Southwest is a huge missed opportunity.
And these local battles in America matter. Given the extremely high per capita energy consumption in the USA, greening state-level energy systems is significant at the global level. It does not compare to the super-sized levels of emissions in China, but it matters.
To take one example, Indonesia is the target of a high-level, globally syndicated Just Energy Transition Program. And this is, of course, a worthy objective that should by-rights be helping to define a sustainable development path for a nation of 275 million people. But, Indonesia’s total installed electricity generating capacity is rated at 81 GW. As far as immediate impact on the global carbon balance is concerned, cleaning up the power systems of Pennsylvania and Illinois would make an even bigger impact.
A key test of Biden-era climate and industrial policy will be whether it can untie the local political economy of fossil fuels, which, across many regions of the United States still stands in the way of a green energy transition that now has all the force of economics and technological advantage on its side.


In reality, battery capacity is tiny. For every wind or solar facility, another source - most often natural gas - is needed to assure power to the grid.
It’s “piqued” not “peaked.”